Spanish vs Immigrants from Colombia Average Family Size
COMPARE
Spanish
Immigrants from Colombia
Average Family Size
Average Family Size Comparison
Spanish
Immigrants from Colombia
3.23
AVERAGE FAMILY SIZE
44.8/ 100
METRIC RATING
181st/ 347
METRIC RANK
3.27
AVERAGE FAMILY SIZE
92.8/ 100
METRIC RATING
122nd/ 347
METRIC RANK
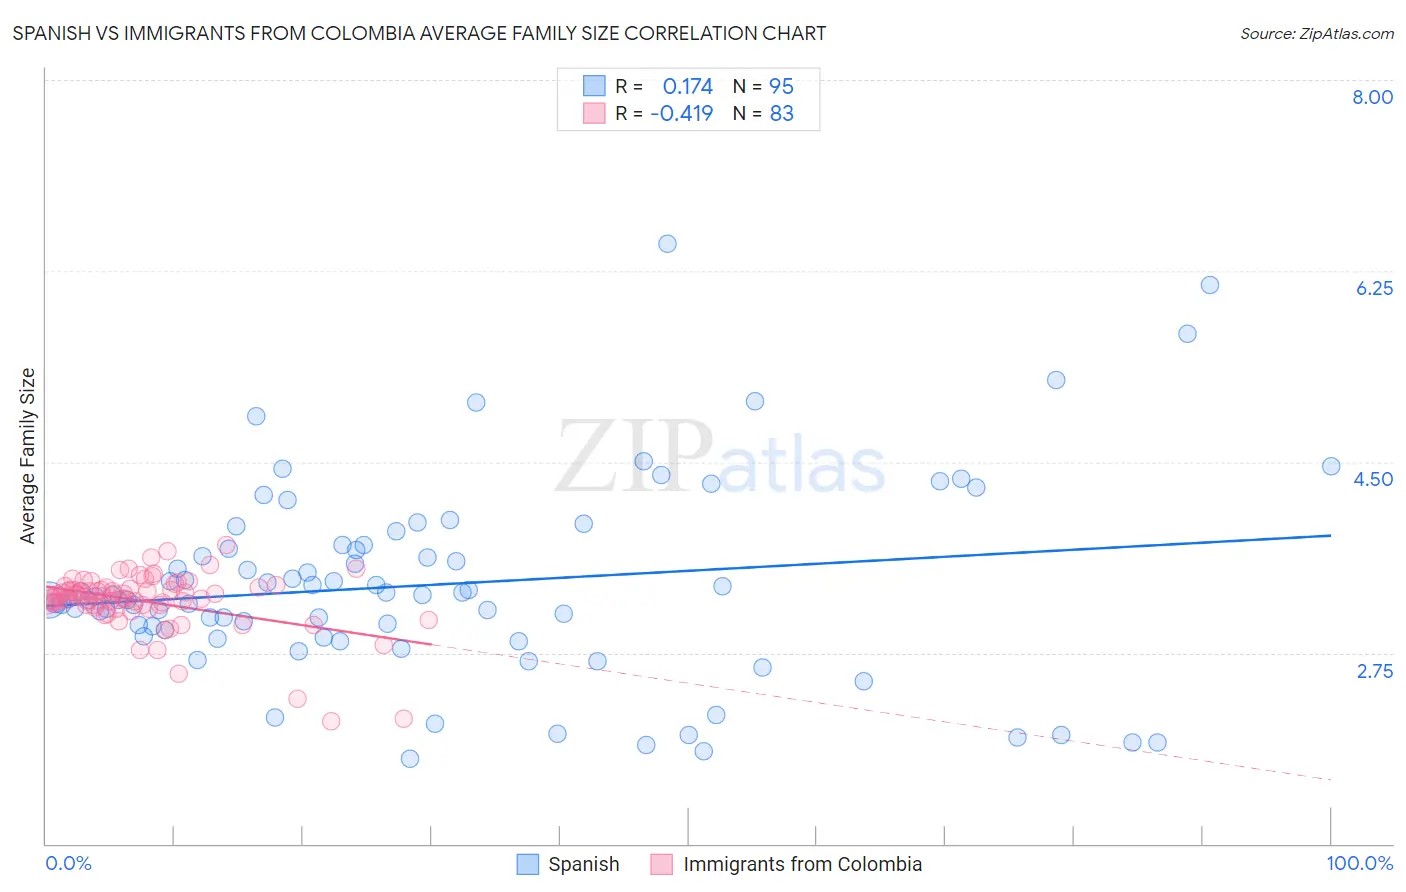
Spanish vs Immigrants from Colombia Average Family Size Correlation Chart
The statistical analysis conducted on geographies consisting of 421,920,076 people shows a poor positive correlation between the proportion of Spanish and average family size in the United States with a correlation coefficient (R) of 0.174 and weighted average of 3.23. Similarly, the statistical analysis conducted on geographies consisting of 378,535,546 people shows a moderate negative correlation between the proportion of Immigrants from Colombia and average family size in the United States with a correlation coefficient (R) of -0.419 and weighted average of 3.27, a difference of 1.3%.
Average Family Size Correlation Summary
| Measurement | Spanish | Immigrants from Colombia |
| Minimum | 1.78 | 2.12 |
| Maximum | 6.50 | 3.74 |
| Range | 4.72 | 1.62 |
| Mean | 3.37 | 3.22 |
| Median | 3.26 | 3.27 |
| Interquartile 25% (IQ1) | 2.90 | 3.18 |
| Interquartile 75% (IQ3) | 3.73 | 3.35 |
| Interquartile Range (IQR) | 0.83 | 0.17 |
| Standard Deviation (Sample) | 0.90 | 0.28 |
| Standard Deviation (Population) | 0.89 | 0.27 |
Similar Demographics by Average Family Size
Demographics Similar to Spanish by Average Family Size
In terms of average family size, the demographic groups most similar to Spanish are Moroccan (3.22, a difference of 0.010%), Palestinian (3.23, a difference of 0.030%), Spaniard (3.23, a difference of 0.040%), Immigrants from Korea (3.23, a difference of 0.040%), and Argentinean (3.23, a difference of 0.050%).
| Demographics | Rating | Rank | Average Family Size |
| Immigrants | South Central Asia | 50.0 /100 | #174 | Average 3.23 |
| Immigrants | China | 49.9 /100 | #175 | Average 3.23 |
| Israelis | 48.7 /100 | #176 | Average 3.23 |
| Argentineans | 47.4 /100 | #177 | Average 3.23 |
| Spaniards | 47.2 /100 | #178 | Average 3.23 |
| Immigrants | Korea | 46.9 /100 | #179 | Average 3.23 |
| Palestinians | 46.6 /100 | #180 | Average 3.23 |
| Spanish | 44.8 /100 | #181 | Average 3.23 |
| Moroccans | 44.2 /100 | #182 | Average 3.22 |
| Immigrants | Northern Africa | 41.7 /100 | #183 | Average 3.22 |
| Immigrants | Eastern Asia | 40.8 /100 | #184 | Average 3.22 |
| Immigrants | Sri Lanka | 39.8 /100 | #185 | Fair 3.22 |
| Immigrants | Argentina | 39.8 /100 | #186 | Fair 3.22 |
| Immigrants | Malaysia | 39.0 /100 | #187 | Fair 3.22 |
| Thais | 38.3 /100 | #188 | Fair 3.22 |
Demographics Similar to Immigrants from Colombia by Average Family Size
In terms of average family size, the demographic groups most similar to Immigrants from Colombia are Alaskan Athabascan (3.27, a difference of 0.020%), Immigrants from Thailand (3.27, a difference of 0.030%), Immigrants from Bahamas (3.27, a difference of 0.060%), Immigrants from Indonesia (3.27, a difference of 0.070%), and South American Indian (3.26, a difference of 0.070%).
| Demographics | Rating | Rank | Average Family Size |
| Immigrants | Liberia | 95.0 /100 | #115 | Exceptional 3.27 |
| Immigrants | South America | 95.0 /100 | #116 | Exceptional 3.27 |
| Kiowa | 94.8 /100 | #117 | Exceptional 3.27 |
| Immigrants | Asia | 94.0 /100 | #118 | Exceptional 3.27 |
| Immigrants | Indonesia | 93.7 /100 | #119 | Exceptional 3.27 |
| Immigrants | Bahamas | 93.6 /100 | #120 | Exceptional 3.27 |
| Immigrants | Thailand | 93.3 /100 | #121 | Exceptional 3.27 |
| Immigrants | Colombia | 92.8 /100 | #122 | Exceptional 3.27 |
| Alaskan Athabascans | 92.4 /100 | #123 | Exceptional 3.27 |
| South American Indians | 91.6 /100 | #124 | Exceptional 3.26 |
| Immigrants | Cuba | 91.3 /100 | #125 | Exceptional 3.26 |
| Immigrants | Costa Rica | 90.7 /100 | #126 | Exceptional 3.26 |
| Immigrants | Syria | 90.6 /100 | #127 | Exceptional 3.26 |
| Colombians | 89.9 /100 | #128 | Excellent 3.26 |
| Immigrants | Hong Kong | 88.6 /100 | #129 | Excellent 3.26 |