Alsatian vs Immigrants from Colombia Average Family Size
COMPARE
Alsatian
Immigrants from Colombia
Average Family Size
Average Family Size Comparison
Alsatians
Immigrants from Colombia
3.14
AVERAGE FAMILY SIZE
0.2/ 100
METRIC RATING
291st/ 347
METRIC RANK
3.27
AVERAGE FAMILY SIZE
92.8/ 100
METRIC RATING
122nd/ 347
METRIC RANK
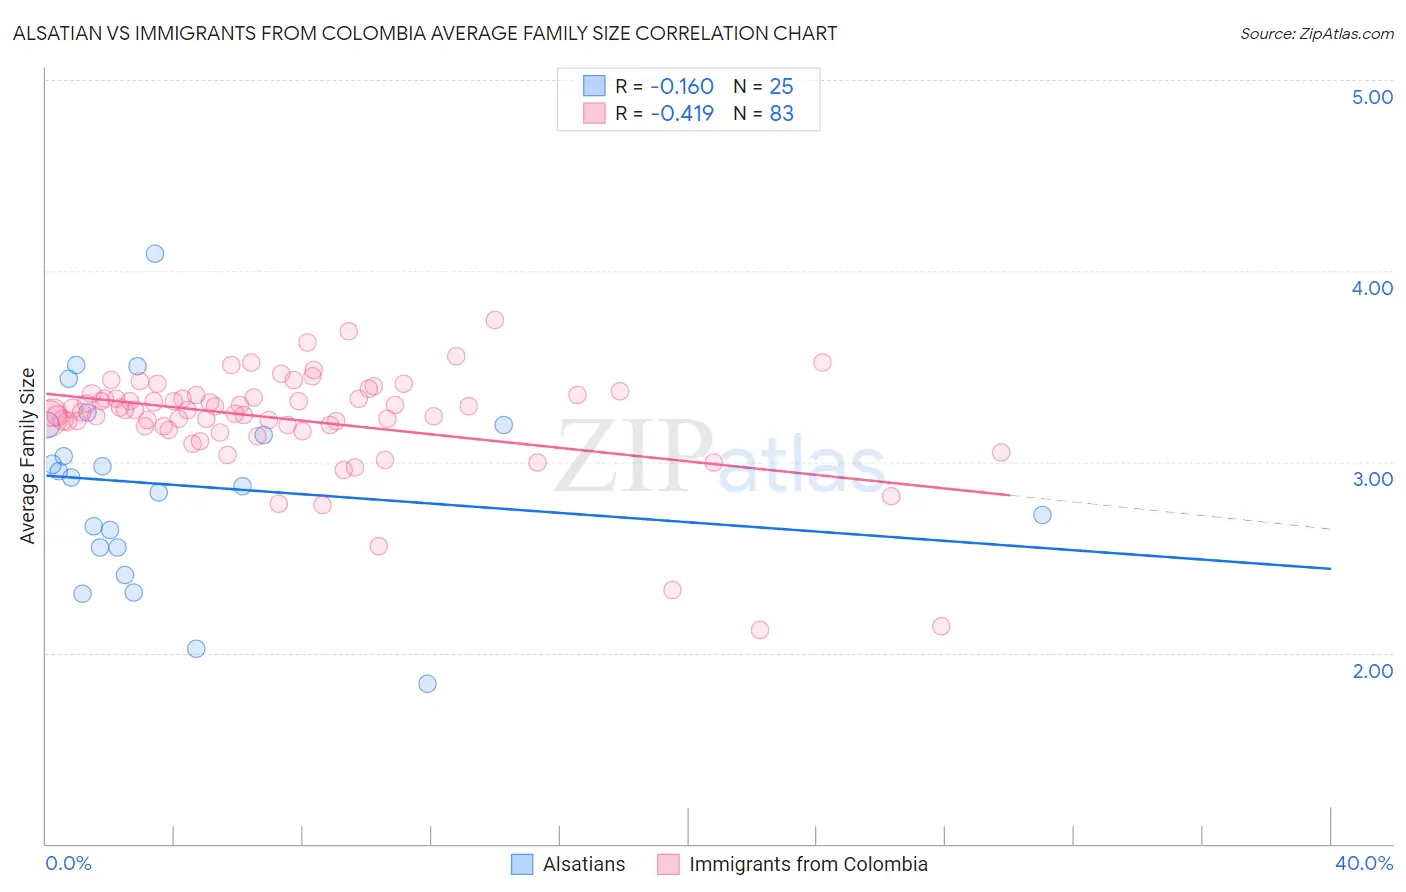
Alsatian vs Immigrants from Colombia Average Family Size Correlation Chart
The statistical analysis conducted on geographies consisting of 82,680,020 people shows a poor negative correlation between the proportion of Alsatians and average family size in the United States with a correlation coefficient (R) of -0.160 and weighted average of 3.14. Similarly, the statistical analysis conducted on geographies consisting of 378,535,546 people shows a moderate negative correlation between the proportion of Immigrants from Colombia and average family size in the United States with a correlation coefficient (R) of -0.419 and weighted average of 3.27, a difference of 4.0%.
Average Family Size Correlation Summary
| Measurement | Alsatian | Immigrants from Colombia |
| Minimum | 1.84 | 2.12 |
| Maximum | 4.09 | 3.74 |
| Range | 2.25 | 1.62 |
| Mean | 2.88 | 3.22 |
| Median | 2.92 | 3.27 |
| Interquartile 25% (IQ1) | 2.55 | 3.18 |
| Interquartile 75% (IQ3) | 3.19 | 3.35 |
| Interquartile Range (IQR) | 0.64 | 0.17 |
| Standard Deviation (Sample) | 0.50 | 0.28 |
| Standard Deviation (Population) | 0.49 | 0.27 |
Similar Demographics by Average Family Size
Demographics Similar to Alsatians by Average Family Size
In terms of average family size, the demographic groups most similar to Alsatians are European (3.14, a difference of 0.020%), Scandinavian (3.14, a difference of 0.030%), Cypriot (3.14, a difference of 0.040%), Immigrants from Croatia (3.14, a difference of 0.050%), and Austrian (3.14, a difference of 0.050%).
| Demographics | Rating | Rank | Average Family Size |
| Immigrants | France | 0.4 /100 | #284 | Tragic 3.15 |
| Whites/Caucasians | 0.3 /100 | #285 | Tragic 3.14 |
| Immigrants | Netherlands | 0.3 /100 | #286 | Tragic 3.14 |
| Greeks | 0.3 /100 | #287 | Tragic 3.14 |
| Immigrants | Czechoslovakia | 0.3 /100 | #288 | Tragic 3.14 |
| Immigrants | Norway | 0.3 /100 | #289 | Tragic 3.14 |
| Cypriots | 0.3 /100 | #290 | Tragic 3.14 |
| Alsatians | 0.2 /100 | #291 | Tragic 3.14 |
| Europeans | 0.2 /100 | #292 | Tragic 3.14 |
| Scandinavians | 0.2 /100 | #293 | Tragic 3.14 |
| Immigrants | Croatia | 0.2 /100 | #294 | Tragic 3.14 |
| Austrians | 0.2 /100 | #295 | Tragic 3.14 |
| Ukrainians | 0.2 /100 | #296 | Tragic 3.14 |
| Immigrants | Western Europe | 0.2 /100 | #297 | Tragic 3.14 |
| Colville | 0.2 /100 | #298 | Tragic 3.14 |
Demographics Similar to Immigrants from Colombia by Average Family Size
In terms of average family size, the demographic groups most similar to Immigrants from Colombia are Alaskan Athabascan (3.27, a difference of 0.020%), Immigrants from Thailand (3.27, a difference of 0.030%), Immigrants from Bahamas (3.27, a difference of 0.060%), Immigrants from Indonesia (3.27, a difference of 0.070%), and South American Indian (3.26, a difference of 0.070%).
| Demographics | Rating | Rank | Average Family Size |
| Immigrants | Liberia | 95.0 /100 | #115 | Exceptional 3.27 |
| Immigrants | South America | 95.0 /100 | #116 | Exceptional 3.27 |
| Kiowa | 94.8 /100 | #117 | Exceptional 3.27 |
| Immigrants | Asia | 94.0 /100 | #118 | Exceptional 3.27 |
| Immigrants | Indonesia | 93.7 /100 | #119 | Exceptional 3.27 |
| Immigrants | Bahamas | 93.6 /100 | #120 | Exceptional 3.27 |
| Immigrants | Thailand | 93.3 /100 | #121 | Exceptional 3.27 |
| Immigrants | Colombia | 92.8 /100 | #122 | Exceptional 3.27 |
| Alaskan Athabascans | 92.4 /100 | #123 | Exceptional 3.27 |
| South American Indians | 91.6 /100 | #124 | Exceptional 3.26 |
| Immigrants | Cuba | 91.3 /100 | #125 | Exceptional 3.26 |
| Immigrants | Costa Rica | 90.7 /100 | #126 | Exceptional 3.26 |
| Immigrants | Syria | 90.6 /100 | #127 | Exceptional 3.26 |
| Colombians | 89.9 /100 | #128 | Excellent 3.26 |
| Immigrants | Hong Kong | 88.6 /100 | #129 | Excellent 3.26 |