Chilean vs Immigrants from Colombia Average Family Size
COMPARE
Chilean
Immigrants from Colombia
Average Family Size
Average Family Size Comparison
Chileans
Immigrants from Colombia
3.23
AVERAGE FAMILY SIZE
53.2/ 100
METRIC RATING
171st/ 347
METRIC RANK
3.27
AVERAGE FAMILY SIZE
92.8/ 100
METRIC RATING
122nd/ 347
METRIC RANK
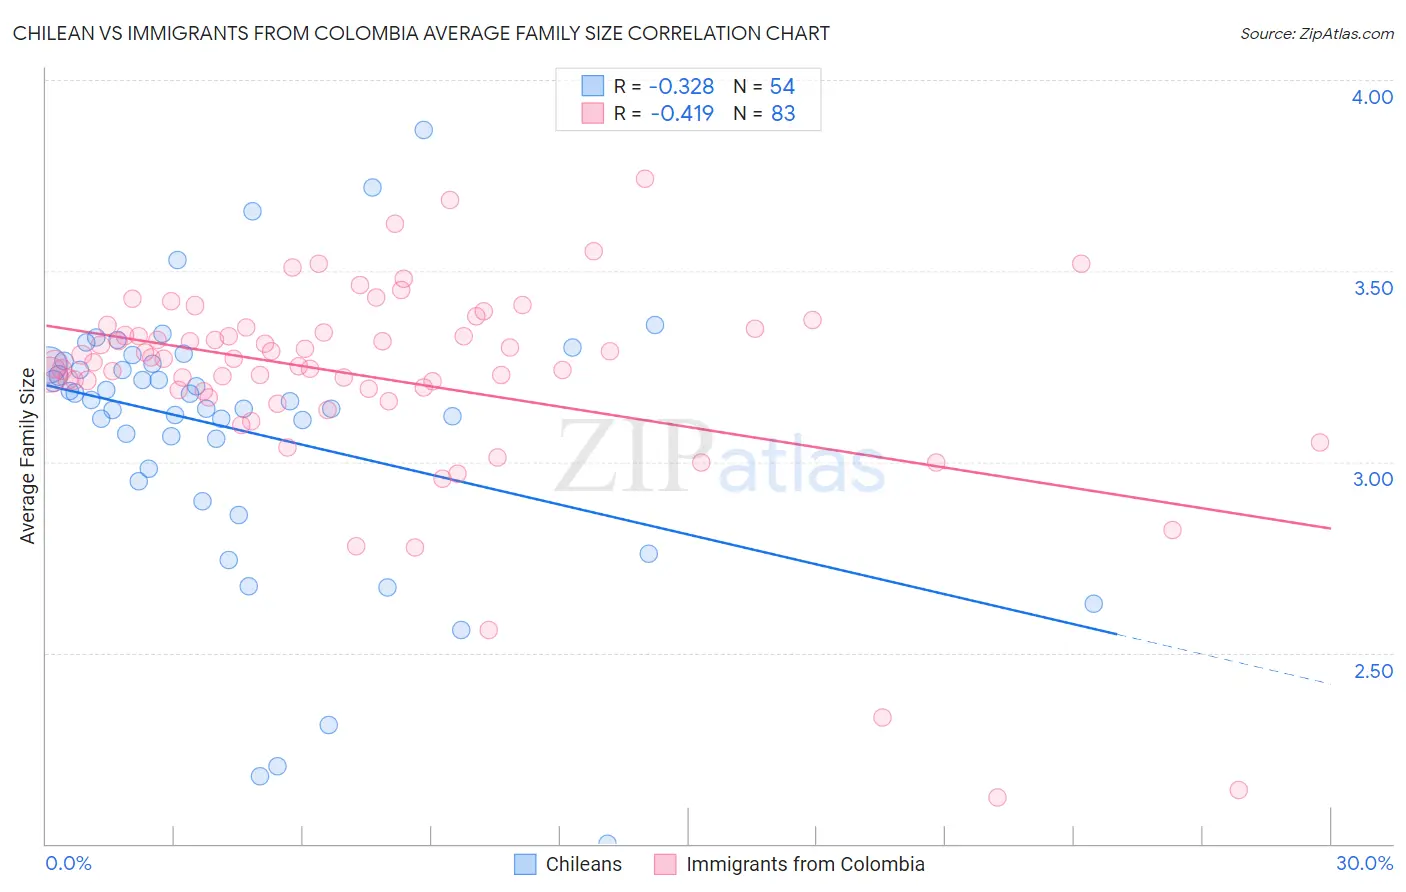
Chilean vs Immigrants from Colombia Average Family Size Correlation Chart
The statistical analysis conducted on geographies consisting of 256,563,974 people shows a mild negative correlation between the proportion of Chileans and average family size in the United States with a correlation coefficient (R) of -0.328 and weighted average of 3.23. Similarly, the statistical analysis conducted on geographies consisting of 378,535,546 people shows a moderate negative correlation between the proportion of Immigrants from Colombia and average family size in the United States with a correlation coefficient (R) of -0.419 and weighted average of 3.27, a difference of 1.1%.
Average Family Size Correlation Summary
| Measurement | Chilean | Immigrants from Colombia |
| Minimum | 2.00 | 2.12 |
| Maximum | 3.87 | 3.74 |
| Range | 1.87 | 1.62 |
| Mean | 3.08 | 3.22 |
| Median | 3.16 | 3.27 |
| Interquartile 25% (IQ1) | 2.98 | 3.18 |
| Interquartile 75% (IQ3) | 3.26 | 3.35 |
| Interquartile Range (IQR) | 0.27 | 0.17 |
| Standard Deviation (Sample) | 0.36 | 0.28 |
| Standard Deviation (Population) | 0.35 | 0.27 |
Similar Demographics by Average Family Size
Demographics Similar to Chileans by Average Family Size
In terms of average family size, the demographic groups most similar to Chileans are Arab (3.23, a difference of 0.010%), Immigrants from Congo (3.23, a difference of 0.010%), Taiwanese (3.23, a difference of 0.020%), Aleut (3.23, a difference of 0.020%), and Immigrants from Uruguay (3.23, a difference of 0.020%).
| Demographics | Rating | Rank | Average Family Size |
| Egyptians | 58.6 /100 | #164 | Average 3.23 |
| Ugandans | 58.4 /100 | #165 | Average 3.23 |
| Immigrants | Senegal | 57.5 /100 | #166 | Average 3.23 |
| Dutch West Indians | 56.9 /100 | #167 | Average 3.23 |
| Taiwanese | 54.2 /100 | #168 | Average 3.23 |
| Aleuts | 54.1 /100 | #169 | Average 3.23 |
| Arabs | 53.8 /100 | #170 | Average 3.23 |
| Chileans | 53.2 /100 | #171 | Average 3.23 |
| Immigrants | Congo | 52.7 /100 | #172 | Average 3.23 |
| Immigrants | Uruguay | 52.0 /100 | #173 | Average 3.23 |
| Immigrants | South Central Asia | 50.0 /100 | #174 | Average 3.23 |
| Immigrants | China | 49.9 /100 | #175 | Average 3.23 |
| Israelis | 48.7 /100 | #176 | Average 3.23 |
| Argentineans | 47.4 /100 | #177 | Average 3.23 |
| Spaniards | 47.2 /100 | #178 | Average 3.23 |
Demographics Similar to Immigrants from Colombia by Average Family Size
In terms of average family size, the demographic groups most similar to Immigrants from Colombia are Alaskan Athabascan (3.27, a difference of 0.020%), Immigrants from Thailand (3.27, a difference of 0.030%), Immigrants from Bahamas (3.27, a difference of 0.060%), Immigrants from Indonesia (3.27, a difference of 0.070%), and South American Indian (3.26, a difference of 0.070%).
| Demographics | Rating | Rank | Average Family Size |
| Immigrants | Liberia | 95.0 /100 | #115 | Exceptional 3.27 |
| Immigrants | South America | 95.0 /100 | #116 | Exceptional 3.27 |
| Kiowa | 94.8 /100 | #117 | Exceptional 3.27 |
| Immigrants | Asia | 94.0 /100 | #118 | Exceptional 3.27 |
| Immigrants | Indonesia | 93.7 /100 | #119 | Exceptional 3.27 |
| Immigrants | Bahamas | 93.6 /100 | #120 | Exceptional 3.27 |
| Immigrants | Thailand | 93.3 /100 | #121 | Exceptional 3.27 |
| Immigrants | Colombia | 92.8 /100 | #122 | Exceptional 3.27 |
| Alaskan Athabascans | 92.4 /100 | #123 | Exceptional 3.27 |
| South American Indians | 91.6 /100 | #124 | Exceptional 3.26 |
| Immigrants | Cuba | 91.3 /100 | #125 | Exceptional 3.26 |
| Immigrants | Costa Rica | 90.7 /100 | #126 | Exceptional 3.26 |
| Immigrants | Syria | 90.6 /100 | #127 | Exceptional 3.26 |
| Colombians | 89.9 /100 | #128 | Excellent 3.26 |
| Immigrants | Hong Kong | 88.6 /100 | #129 | Excellent 3.26 |