Czech vs Immigrants from Colombia Median Household Income
COMPARE
Czech
Immigrants from Colombia
Median Household Income
Median Household Income Comparison
Czechs
Immigrants from Colombia
$86,164
MEDIAN HOUSEHOLD INCOME
66.4/ 100
METRIC RATING
163rd/ 347
METRIC RANK
$83,902
MEDIAN HOUSEHOLD INCOME
31.7/ 100
METRIC RATING
189th/ 347
METRIC RANK
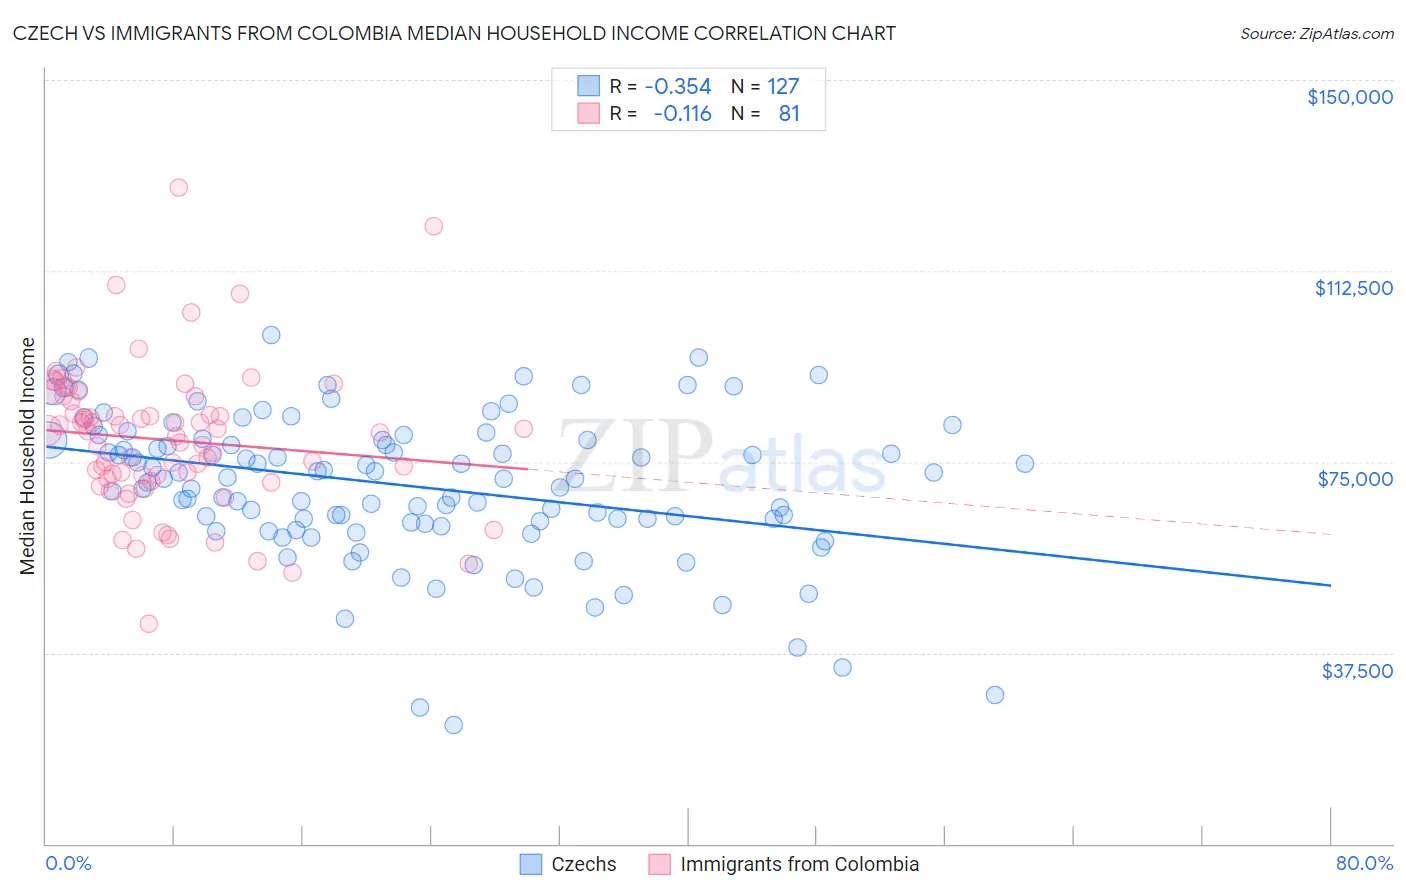
Czech vs Immigrants from Colombia Median Household Income Correlation Chart
The statistical analysis conducted on geographies consisting of 484,294,688 people shows a mild negative correlation between the proportion of Czechs and median household income in the United States with a correlation coefficient (R) of -0.354 and weighted average of $86,164. Similarly, the statistical analysis conducted on geographies consisting of 378,453,155 people shows a poor negative correlation between the proportion of Immigrants from Colombia and median household income in the United States with a correlation coefficient (R) of -0.116 and weighted average of $83,902, a difference of 2.7%.
Median Household Income Correlation Summary
| Measurement | Czech | Immigrants from Colombia |
| Minimum | $23,393 | $43,124 |
| Maximum | $99,887 | $128,990 |
| Range | $76,494 | $85,865 |
| Mean | $70,465 | $79,298 |
| Median | $71,750 | $80,865 |
| Interquartile 25% (IQ1) | $63,125 | $71,504 |
| Interquartile 75% (IQ3) | $79,521 | $87,336 |
| Interquartile Range (IQR) | $16,396 | $15,833 |
| Standard Deviation (Sample) | $14,479 | $14,245 |
| Standard Deviation (Population) | $14,422 | $14,157 |
Similar Demographics by Median Household Income
Demographics Similar to Czechs by Median Household Income
In terms of median household income, the demographic groups most similar to Czechs are Irish ($86,145, a difference of 0.020%), Norwegian ($86,084, a difference of 0.090%), Guamanian/Chamorro ($86,255, a difference of 0.11%), Scandinavian ($86,073, a difference of 0.11%), and Slavic ($86,398, a difference of 0.27%).
| Demographics | Rating | Rank | Median Household Income |
| Immigrants | Albania | 71.5 /100 | #156 | Good $86,534 |
| Samoans | 71.0 /100 | #157 | Good $86,498 |
| Moroccans | 70.6 /100 | #158 | Good $86,468 |
| Immigrants | Uzbekistan | 70.1 /100 | #159 | Good $86,425 |
| Luxembourgers | 70.0 /100 | #160 | Good $86,418 |
| Slavs | 69.7 /100 | #161 | Good $86,398 |
| Guamanians/Chamorros | 67.7 /100 | #162 | Good $86,255 |
| Czechs | 66.4 /100 | #163 | Good $86,164 |
| Irish | 66.2 /100 | #164 | Good $86,145 |
| Norwegians | 65.3 /100 | #165 | Good $86,084 |
| Scandinavians | 65.1 /100 | #166 | Good $86,073 |
| Immigrants | Immigrants | 61.3 /100 | #167 | Good $85,818 |
| Icelanders | 61.0 /100 | #168 | Good $85,797 |
| Colombians | 59.7 /100 | #169 | Average $85,716 |
| Swiss | 59.2 /100 | #170 | Average $85,681 |
Demographics Similar to Immigrants from Colombia by Median Household Income
In terms of median household income, the demographic groups most similar to Immigrants from Colombia are Tlingit-Haida ($83,968, a difference of 0.080%), Slovak ($83,798, a difference of 0.12%), Puget Sound Salish ($84,011, a difference of 0.13%), Belgian ($84,008, a difference of 0.13%), and Iraqi ($83,753, a difference of 0.18%).
| Demographics | Rating | Rank | Median Household Income |
| Uruguayans | 43.5 /100 | #182 | Average $84,691 |
| Spaniards | 42.7 /100 | #183 | Average $84,644 |
| Immigrants | Eastern Africa | 37.4 /100 | #184 | Fair $84,299 |
| Kenyans | 34.2 /100 | #185 | Fair $84,085 |
| Puget Sound Salish | 33.2 /100 | #186 | Fair $84,011 |
| Belgians | 33.2 /100 | #187 | Fair $84,008 |
| Tlingit-Haida | 32.6 /100 | #188 | Fair $83,968 |
| Immigrants | Colombia | 31.7 /100 | #189 | Fair $83,902 |
| Slovaks | 30.2 /100 | #190 | Fair $83,798 |
| Iraqis | 29.6 /100 | #191 | Fair $83,753 |
| Welsh | 28.0 /100 | #192 | Fair $83,628 |
| Finns | 27.7 /100 | #193 | Fair $83,607 |
| Ghanaians | 27.4 /100 | #194 | Fair $83,582 |
| Immigrants | Armenia | 27.0 /100 | #195 | Fair $83,555 |
| French | 26.0 /100 | #196 | Fair $83,468 |