Sioux vs Marshallese Currently Married
COMPARE
Sioux
Marshallese
Currently Married
Currently Married Comparison
Sioux
Marshallese
41.9%
CURRENTLY MARRIED
0.0/ 100
METRIC RATING
303rd/ 347
METRIC RANK
45.5%
CURRENTLY MARRIED
7.2/ 100
METRIC RATING
212th/ 347
METRIC RANK
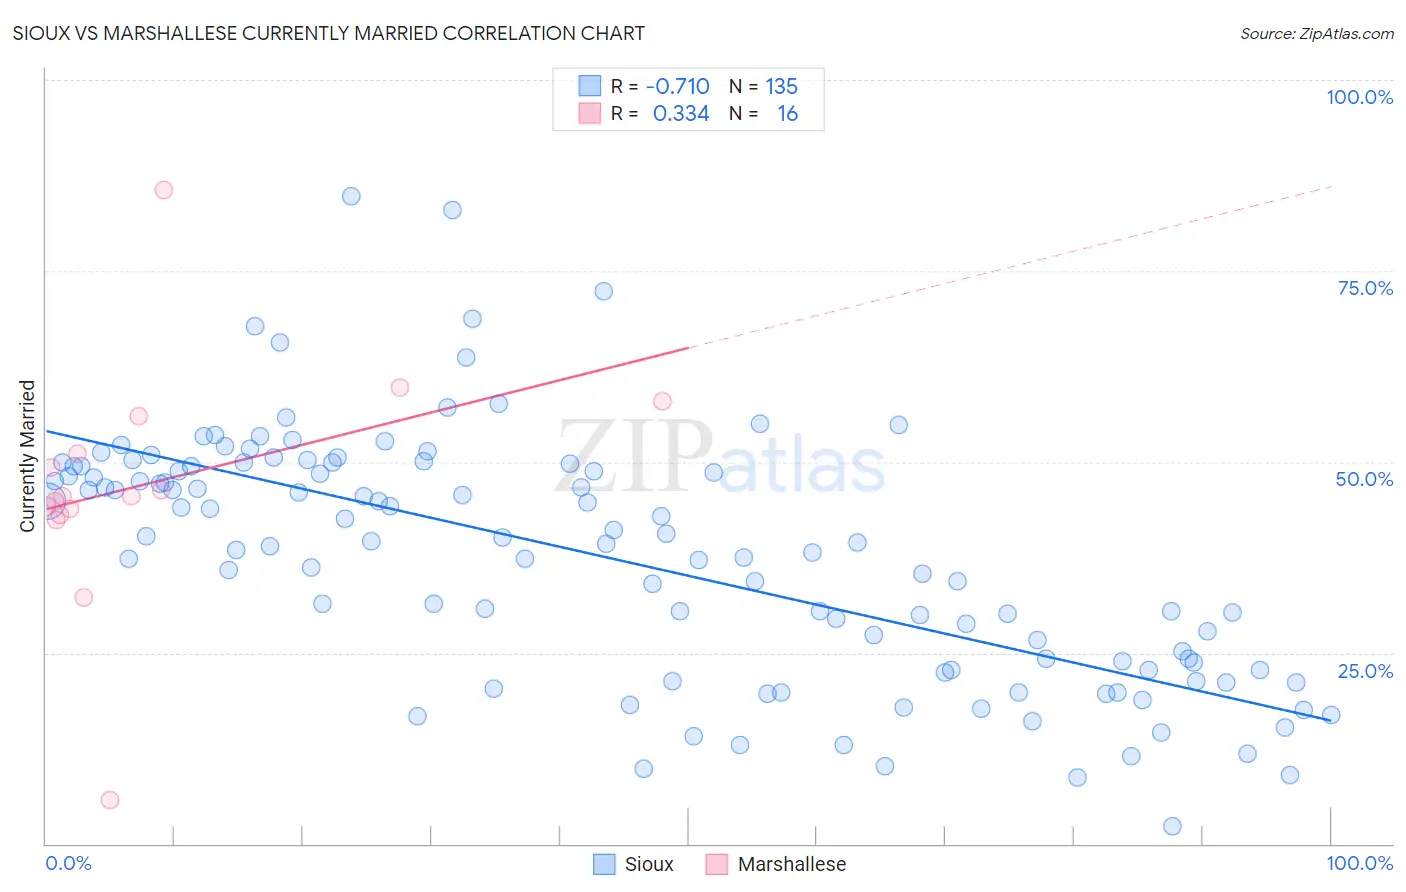
Sioux vs Marshallese Currently Married Correlation Chart
The statistical analysis conducted on geographies consisting of 234,188,920 people shows a strong negative correlation between the proportion of Sioux and percentage of population currently married in the United States with a correlation coefficient (R) of -0.710 and weighted average of 41.9%. Similarly, the statistical analysis conducted on geographies consisting of 14,761,315 people shows a mild positive correlation between the proportion of Marshallese and percentage of population currently married in the United States with a correlation coefficient (R) of 0.334 and weighted average of 45.5%, a difference of 8.6%.
Currently Married Correlation Summary
| Measurement | Sioux | Marshallese |
| Minimum | 2.3% | 5.8% |
| Maximum | 84.8% | 85.6% |
| Range | 82.5% | 79.8% |
| Mean | 37.5% | 47.1% |
| Median | 39.4% | 45.5% |
| Interquartile 25% (IQ1) | 22.8% | 43.5% |
| Interquartile 75% (IQ3) | 49.5% | 53.5% |
| Interquartile Range (IQR) | 26.7% | 10.0% |
| Standard Deviation (Sample) | 16.0% | 16.0% |
| Standard Deviation (Population) | 16.0% | 15.5% |
Similar Demographics by Currently Married
Demographics Similar to Sioux by Currently Married
In terms of currently married, the demographic groups most similar to Sioux are Immigrants from Zaire (42.0%, a difference of 0.010%), Immigrants from Bahamas (41.9%, a difference of 0.11%), Immigrants from Trinidad and Tobago (41.9%, a difference of 0.15%), Immigrants from Guyana (41.9%, a difference of 0.16%), and Immigrants from Yemen (42.1%, a difference of 0.26%).
| Demographics | Rating | Rank | Currently Married |
| Menominee | 0.0 /100 | #296 | Tragic 42.3% |
| Cheyenne | 0.0 /100 | #297 | Tragic 42.2% |
| Immigrants | Honduras | 0.0 /100 | #298 | Tragic 42.2% |
| Liberians | 0.0 /100 | #299 | Tragic 42.2% |
| Belizeans | 0.0 /100 | #300 | Tragic 42.2% |
| Immigrants | Yemen | 0.0 /100 | #301 | Tragic 42.1% |
| Immigrants | Zaire | 0.0 /100 | #302 | Tragic 42.0% |
| Sioux | 0.0 /100 | #303 | Tragic 41.9% |
| Immigrants | Bahamas | 0.0 /100 | #304 | Tragic 41.9% |
| Immigrants | Trinidad and Tobago | 0.0 /100 | #305 | Tragic 41.9% |
| Immigrants | Guyana | 0.0 /100 | #306 | Tragic 41.9% |
| Africans | 0.0 /100 | #307 | Tragic 41.8% |
| Immigrants | Belize | 0.0 /100 | #308 | Tragic 41.8% |
| Immigrants | Liberia | 0.0 /100 | #309 | Tragic 41.8% |
| Guyanese | 0.0 /100 | #310 | Tragic 41.6% |
Demographics Similar to Marshallese by Currently Married
In terms of currently married, the demographic groups most similar to Marshallese are Houma (45.5%, a difference of 0.010%), Alaska Native (45.5%, a difference of 0.030%), Dutch West Indian (45.5%, a difference of 0.070%), German Russian (45.5%, a difference of 0.070%), and Uruguayan (45.6%, a difference of 0.090%).
| Demographics | Rating | Rank | Currently Married |
| South American Indians | 11.5 /100 | #205 | Poor 45.8% |
| Immigrants | Immigrants | 11.2 /100 | #206 | Poor 45.8% |
| Immigrants | South America | 10.8 /100 | #207 | Poor 45.7% |
| Alsatians | 10.8 /100 | #208 | Poor 45.7% |
| Immigrants | Micronesia | 8.8 /100 | #209 | Tragic 45.6% |
| Uruguayans | 7.9 /100 | #210 | Tragic 45.6% |
| Houma | 7.2 /100 | #211 | Tragic 45.5% |
| Marshallese | 7.2 /100 | #212 | Tragic 45.5% |
| Alaska Natives | 7.0 /100 | #213 | Tragic 45.5% |
| Dutch West Indians | 6.7 /100 | #214 | Tragic 45.5% |
| German Russians | 6.7 /100 | #215 | Tragic 45.5% |
| Immigrants | Morocco | 5.5 /100 | #216 | Tragic 45.4% |
| Immigrants | Thailand | 5.1 /100 | #217 | Tragic 45.4% |
| Panamanians | 4.0 /100 | #218 | Tragic 45.3% |
| Immigrants | Portugal | 3.5 /100 | #219 | Tragic 45.2% |