Crow vs Marshallese No Schooling Completed
COMPARE
Crow
Marshallese
No Schooling Completed
No Schooling Completed Comparison
Crow
Marshallese
1.6%
NO SCHOOLING COMPLETED
99.8/ 100
METRIC RATING
54th/ 347
METRIC RANK
2.0%
NO SCHOOLING COMPLETED
83.5/ 100
METRIC RATING
140th/ 347
METRIC RANK
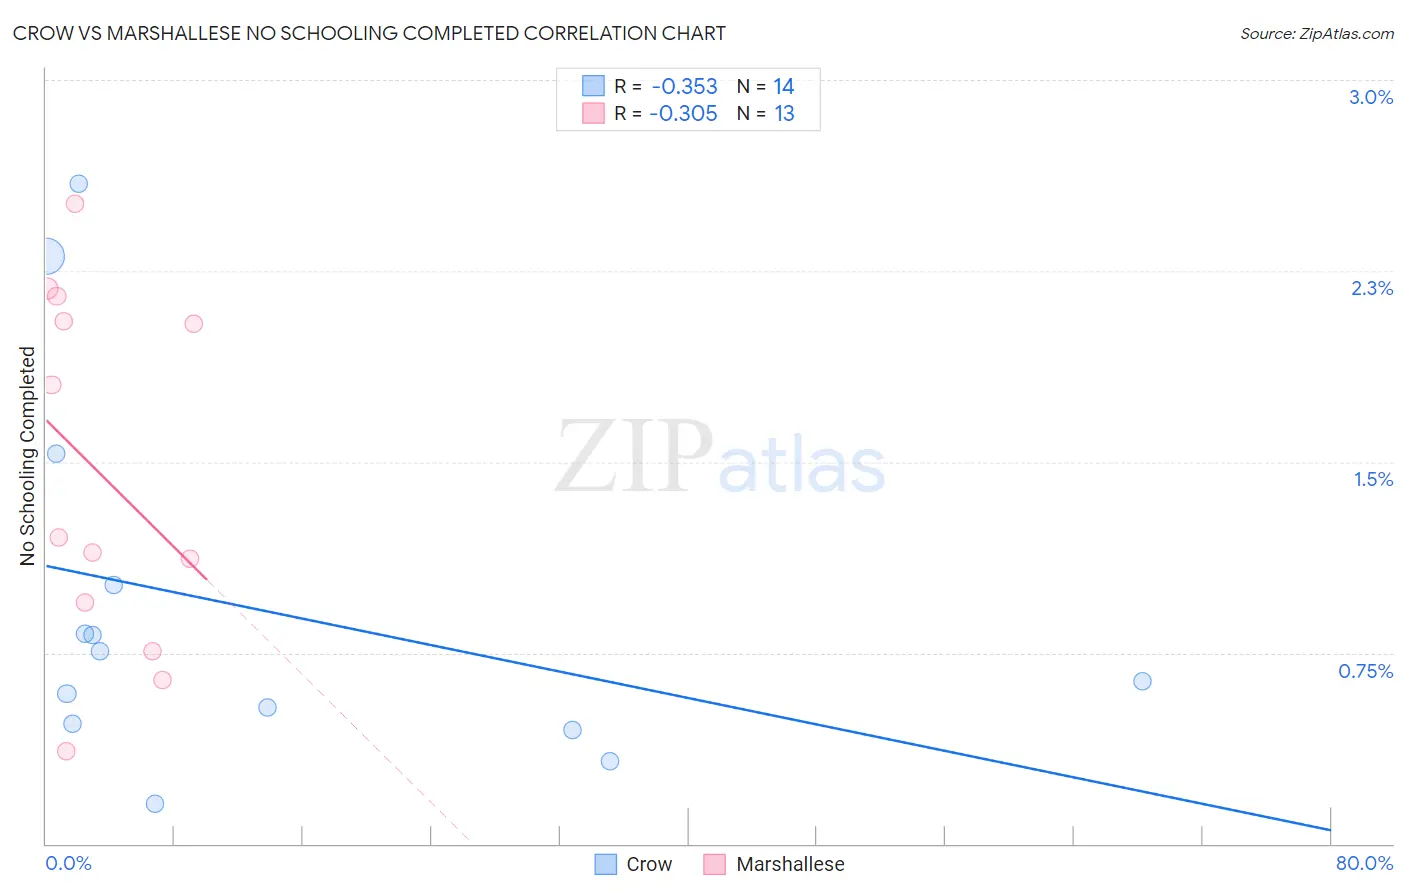
Crow vs Marshallese No Schooling Completed Correlation Chart
The statistical analysis conducted on geographies consisting of 58,922,127 people shows a mild negative correlation between the proportion of Crow and percentage of population with no schooling in the United States with a correlation coefficient (R) of -0.353 and weighted average of 1.6%. Similarly, the statistical analysis conducted on geographies consisting of 14,733,291 people shows a mild negative correlation between the proportion of Marshallese and percentage of population with no schooling in the United States with a correlation coefficient (R) of -0.305 and weighted average of 2.0%, a difference of 20.6%.
No Schooling Completed Correlation Summary
| Measurement | Crow | Marshallese |
| Minimum | 0.16% | 0.36% |
| Maximum | 2.6% | 2.5% |
| Range | 2.4% | 2.1% |
| Mean | 0.93% | 1.5% |
| Median | 0.70% | 1.2% |
| Interquartile 25% (IQ1) | 0.47% | 0.85% |
| Interquartile 75% (IQ3) | 1.0% | 2.1% |
| Interquartile Range (IQR) | 0.55% | 1.2% |
| Standard Deviation (Sample) | 0.73% | 0.70% |
| Standard Deviation (Population) | 0.70% | 0.67% |
Similar Demographics by No Schooling Completed
Demographics Similar to Crow by No Schooling Completed
In terms of no schooling completed, the demographic groups most similar to Crow are Creek (1.6%, a difference of 0.030%), Greek (1.6%, a difference of 0.12%), Immigrants from North America (1.6%, a difference of 0.12%), Immigrants from Canada (1.6%, a difference of 0.16%), and Chippewa (1.6%, a difference of 0.23%).
| Demographics | Rating | Rank | No Schooling Completed |
| Ottawa | 99.9 /100 | #47 | Exceptional 1.6% |
| Immigrants | Scotland | 99.9 /100 | #48 | Exceptional 1.6% |
| Whites/Caucasians | 99.9 /100 | #49 | Exceptional 1.6% |
| Celtics | 99.9 /100 | #50 | Exceptional 1.6% |
| Chippewa | 99.8 /100 | #51 | Exceptional 1.6% |
| Immigrants | Canada | 99.8 /100 | #52 | Exceptional 1.6% |
| Creek | 99.8 /100 | #53 | Exceptional 1.6% |
| Crow | 99.8 /100 | #54 | Exceptional 1.6% |
| Greeks | 99.8 /100 | #55 | Exceptional 1.6% |
| Immigrants | North America | 99.8 /100 | #56 | Exceptional 1.6% |
| Austrians | 99.8 /100 | #57 | Exceptional 1.6% |
| Kiowa | 99.8 /100 | #58 | Exceptional 1.6% |
| Slavs | 99.8 /100 | #59 | Exceptional 1.7% |
| Americans | 99.8 /100 | #60 | Exceptional 1.7% |
| Tsimshian | 99.8 /100 | #61 | Exceptional 1.7% |
Demographics Similar to Marshallese by No Schooling Completed
In terms of no schooling completed, the demographic groups most similar to Marshallese are Immigrants from Greece (2.0%, a difference of 0.010%), Jordanian (2.0%, a difference of 0.26%), Venezuelan (2.0%, a difference of 0.50%), Immigrants from Israel (2.0%, a difference of 0.51%), and Filipino (2.0%, a difference of 0.55%).
| Demographics | Rating | Rank | No Schooling Completed |
| Immigrants | Turkey | 90.2 /100 | #133 | Exceptional 1.9% |
| Menominee | 89.6 /100 | #134 | Excellent 1.9% |
| Hmong | 88.5 /100 | #135 | Excellent 1.9% |
| Burmese | 88.2 /100 | #136 | Excellent 1.9% |
| Filipinos | 85.5 /100 | #137 | Excellent 2.0% |
| Immigrants | Israel | 85.4 /100 | #138 | Excellent 2.0% |
| Jordanians | 84.5 /100 | #139 | Excellent 2.0% |
| Marshallese | 83.5 /100 | #140 | Excellent 2.0% |
| Immigrants | Greece | 83.5 /100 | #141 | Excellent 2.0% |
| Venezuelans | 81.5 /100 | #142 | Excellent 2.0% |
| Immigrants | South Central Asia | 80.0 /100 | #143 | Good 2.0% |
| Alsatians | 79.1 /100 | #144 | Good 2.0% |
| Immigrants | Iran | 79.0 /100 | #145 | Good 2.0% |
| Immigrants | Moldova | 78.0 /100 | #146 | Good 2.0% |
| Soviet Union | 77.1 /100 | #147 | Good 2.0% |