Immigrants from England vs Immigrants from Eastern Asia Currently Married
COMPARE
Immigrants from England
Immigrants from Eastern Asia
Currently Married
Currently Married Comparison
Immigrants from England
Immigrants from Eastern Asia
48.3%
CURRENTLY MARRIED
98.2/ 100
METRIC RATING
68th/ 347
METRIC RANK
48.2%
CURRENTLY MARRIED
97.5/ 100
METRIC RATING
73rd/ 347
METRIC RANK
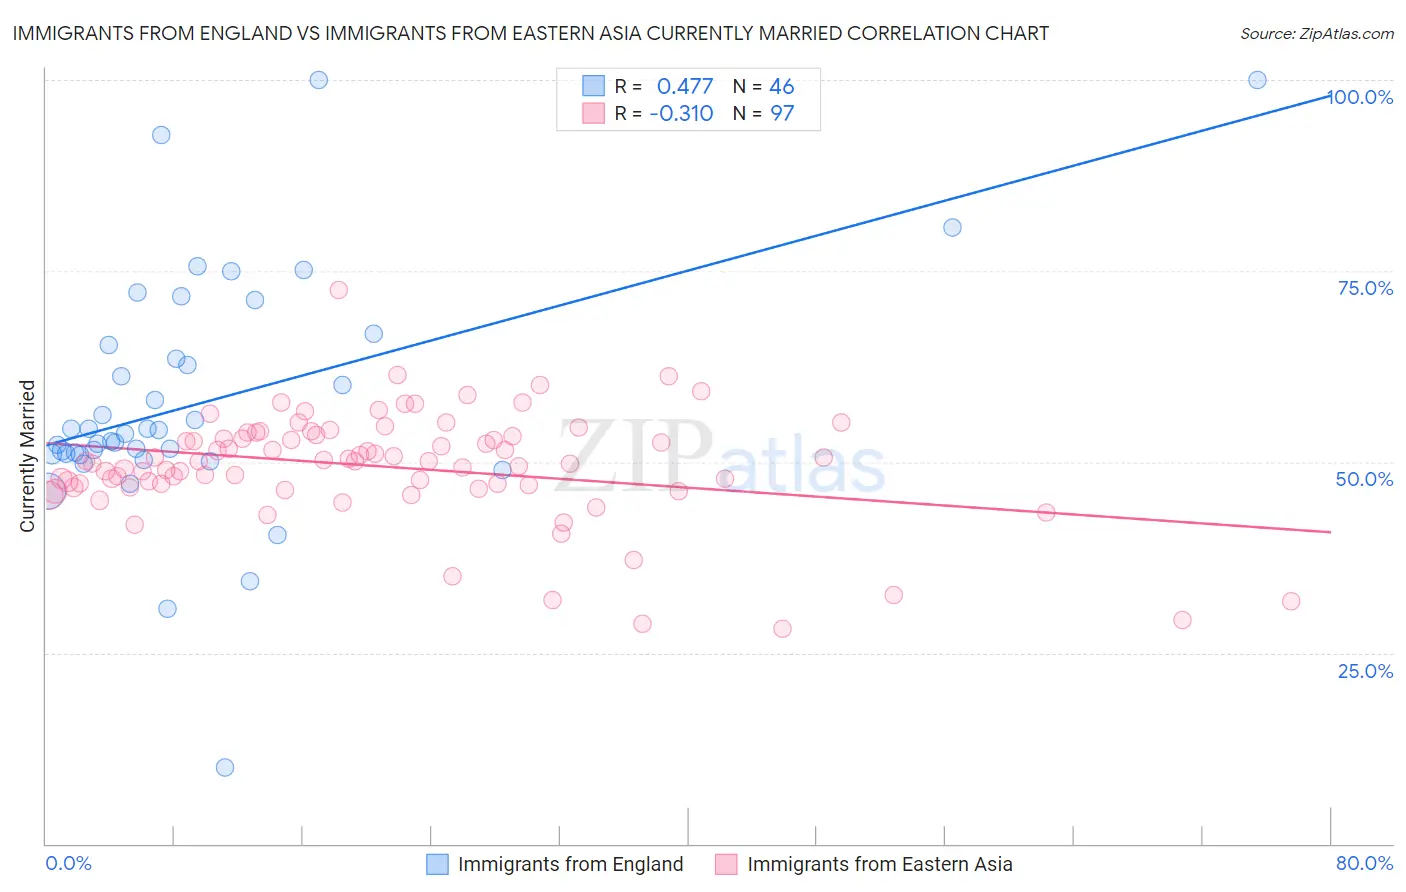
Immigrants from England vs Immigrants from Eastern Asia Currently Married Correlation Chart
The statistical analysis conducted on geographies consisting of 391,864,919 people shows a moderate positive correlation between the proportion of Immigrants from England and percentage of population currently married in the United States with a correlation coefficient (R) of 0.477 and weighted average of 48.3%. Similarly, the statistical analysis conducted on geographies consisting of 499,820,876 people shows a mild negative correlation between the proportion of Immigrants from Eastern Asia and percentage of population currently married in the United States with a correlation coefficient (R) of -0.310 and weighted average of 48.2%, a difference of 0.28%.
Currently Married Correlation Summary
| Measurement | Immigrants from England | Immigrants from Eastern Asia |
| Minimum | 10.0% | 28.1% |
| Maximum | 100.0% | 72.5% |
| Range | 90.0% | 44.4% |
| Mean | 57.9% | 49.4% |
| Median | 54.0% | 50.0% |
| Interquartile 25% (IQ1) | 51.0% | 46.8% |
| Interquartile 75% (IQ3) | 65.3% | 53.5% |
| Interquartile Range (IQR) | 14.3% | 6.7% |
| Standard Deviation (Sample) | 16.3% | 7.2% |
| Standard Deviation (Population) | 16.1% | 7.2% |
Demographics Similar to Immigrants from England and Immigrants from Eastern Asia by Currently Married
In terms of currently married, the demographic groups most similar to Immigrants from England are Slovak (48.3%, a difference of 0.010%), Tongan (48.3%, a difference of 0.020%), Canadian (48.3%, a difference of 0.020%), Ukrainian (48.4%, a difference of 0.050%), and Slavic (48.4%, a difference of 0.060%). Similarly, the demographic groups most similar to Immigrants from Eastern Asia are Immigrants from Lebanon (48.2%, a difference of 0.020%), Estonian (48.2%, a difference of 0.030%), Immigrants from Belarus (48.1%, a difference of 0.10%), Basque (48.1%, a difference of 0.12%), and Slovene (48.1%, a difference of 0.14%).
| Demographics | Rating | Rank | Currently Married |
| Immigrants | Romania | 98.5 /100 | #60 | Exceptional 48.4% |
| Romanians | 98.5 /100 | #61 | Exceptional 48.4% |
| Asians | 98.5 /100 | #62 | Exceptional 48.4% |
| Slavs | 98.3 /100 | #63 | Exceptional 48.4% |
| Immigrants | Czechoslovakia | 98.3 /100 | #64 | Exceptional 48.4% |
| Ukrainians | 98.3 /100 | #65 | Exceptional 48.4% |
| Tongans | 98.2 /100 | #66 | Exceptional 48.3% |
| Slovaks | 98.2 /100 | #67 | Exceptional 48.3% |
| Immigrants | England | 98.2 /100 | #68 | Exceptional 48.3% |
| Canadians | 98.1 /100 | #69 | Exceptional 48.3% |
| Immigrants | Asia | 97.9 /100 | #70 | Exceptional 48.3% |
| Macedonians | 97.9 /100 | #71 | Exceptional 48.3% |
| Immigrants | Lebanon | 97.6 /100 | #72 | Exceptional 48.2% |
| Immigrants | Eastern Asia | 97.5 /100 | #73 | Exceptional 48.2% |
| Estonians | 97.4 /100 | #74 | Exceptional 48.2% |
| Immigrants | Belarus | 97.2 /100 | #75 | Exceptional 48.1% |
| Basques | 97.2 /100 | #76 | Exceptional 48.1% |
| Slovenes | 97.1 /100 | #77 | Exceptional 48.1% |
| Immigrants | Belgium | 97.1 /100 | #78 | Exceptional 48.1% |
| Immigrants | South Africa | 97.0 /100 | #79 | Exceptional 48.1% |
| Immigrants | Poland | 96.9 /100 | #80 | Exceptional 48.1% |