Polish vs Immigrants from Eastern Asia Currently Married
COMPARE
Polish
Immigrants from Eastern Asia
Currently Married
Currently Married Comparison
Poles
Immigrants from Eastern Asia
48.9%
CURRENTLY MARRIED
99.5/ 100
METRIC RATING
31st/ 347
METRIC RANK
48.2%
CURRENTLY MARRIED
97.5/ 100
METRIC RATING
73rd/ 347
METRIC RANK
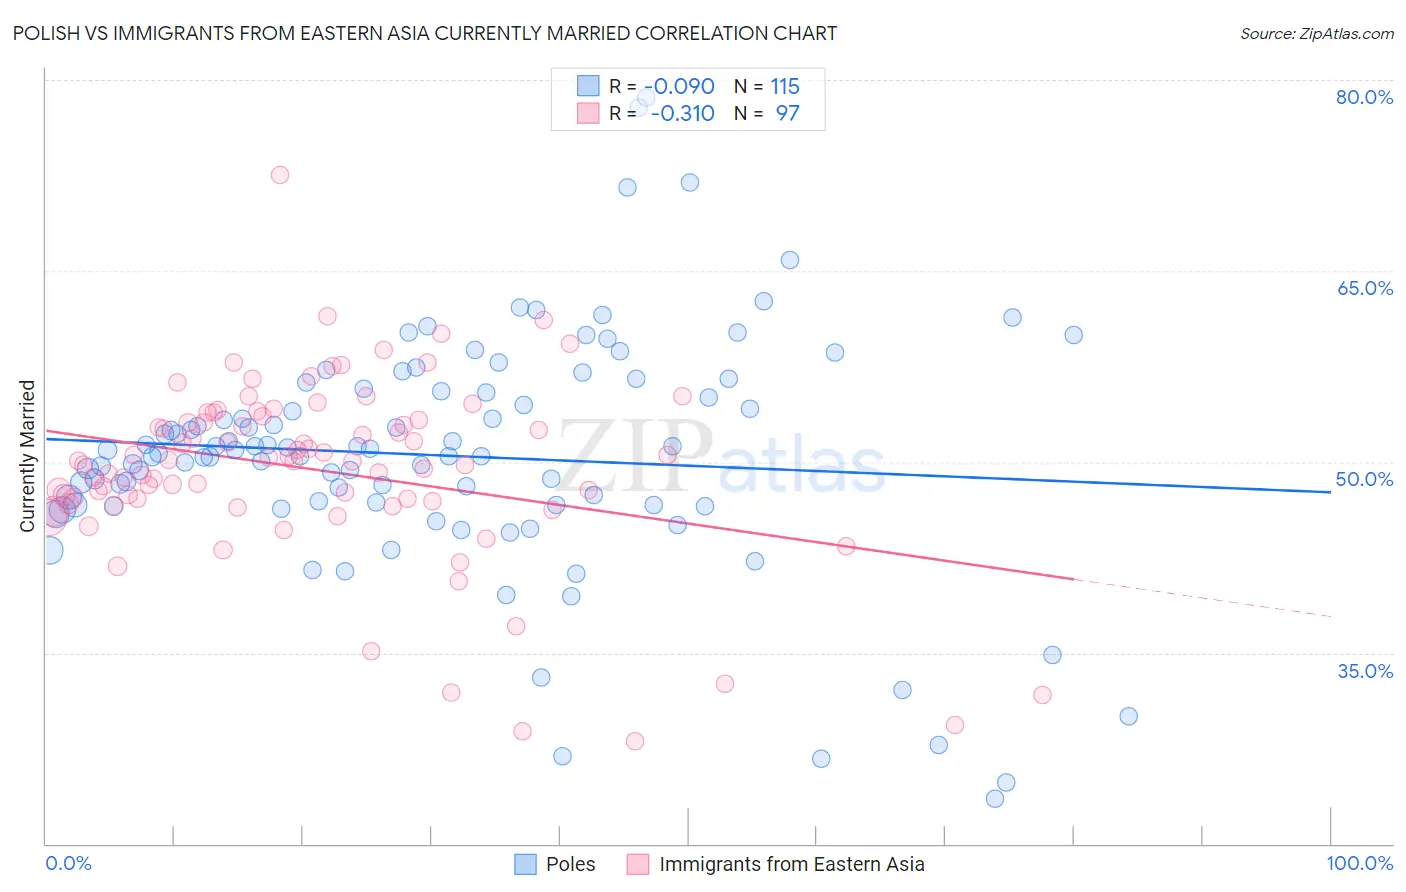
Polish vs Immigrants from Eastern Asia Currently Married Correlation Chart
The statistical analysis conducted on geographies consisting of 560,467,827 people shows a slight negative correlation between the proportion of Poles and percentage of population currently married in the United States with a correlation coefficient (R) of -0.090 and weighted average of 48.9%. Similarly, the statistical analysis conducted on geographies consisting of 499,820,876 people shows a mild negative correlation between the proportion of Immigrants from Eastern Asia and percentage of population currently married in the United States with a correlation coefficient (R) of -0.310 and weighted average of 48.2%, a difference of 1.5%.
Currently Married Correlation Summary
| Measurement | Polish | Immigrants from Eastern Asia |
| Minimum | 23.5% | 28.1% |
| Maximum | 78.6% | 72.5% |
| Range | 55.1% | 44.4% |
| Mean | 50.5% | 49.4% |
| Median | 50.7% | 50.0% |
| Interquartile 25% (IQ1) | 46.6% | 46.8% |
| Interquartile 75% (IQ3) | 55.6% | 53.5% |
| Interquartile Range (IQR) | 9.0% | 6.7% |
| Standard Deviation (Sample) | 9.4% | 7.2% |
| Standard Deviation (Population) | 9.3% | 7.2% |
Similar Demographics by Currently Married
Demographics Similar to Poles by Currently Married
In terms of currently married, the demographic groups most similar to Poles are Eastern European (48.9%, a difference of 0.0%), Croatian (48.9%, a difference of 0.010%), Immigrants from Hong Kong (48.9%, a difference of 0.010%), Irish (48.9%, a difference of 0.050%), and Welsh (48.9%, a difference of 0.060%).
| Demographics | Rating | Rank | Currently Married |
| Lithuanians | 99.6 /100 | #24 | Exceptional 49.0% |
| Maltese | 99.6 /100 | #25 | Exceptional 49.0% |
| Immigrants | Korea | 99.6 /100 | #26 | Exceptional 49.0% |
| Burmese | 99.6 /100 | #27 | Exceptional 48.9% |
| Welsh | 99.5 /100 | #28 | Exceptional 48.9% |
| Croatians | 99.5 /100 | #29 | Exceptional 48.9% |
| Eastern Europeans | 99.5 /100 | #30 | Exceptional 48.9% |
| Poles | 99.5 /100 | #31 | Exceptional 48.9% |
| Immigrants | Hong Kong | 99.5 /100 | #32 | Exceptional 48.9% |
| Irish | 99.5 /100 | #33 | Exceptional 48.9% |
| Immigrants | Lithuania | 99.4 /100 | #34 | Exceptional 48.8% |
| Immigrants | Northern Europe | 99.4 /100 | #35 | Exceptional 48.8% |
| Italians | 99.4 /100 | #36 | Exceptional 48.8% |
| Hungarians | 99.4 /100 | #37 | Exceptional 48.8% |
| Czechoslovakians | 99.4 /100 | #38 | Exceptional 48.8% |
Demographics Similar to Immigrants from Eastern Asia by Currently Married
In terms of currently married, the demographic groups most similar to Immigrants from Eastern Asia are Immigrants from Lebanon (48.2%, a difference of 0.020%), Estonian (48.2%, a difference of 0.030%), Immigrants from Belarus (48.1%, a difference of 0.10%), Basque (48.1%, a difference of 0.12%), and Slovene (48.1%, a difference of 0.14%).
| Demographics | Rating | Rank | Currently Married |
| Tongans | 98.2 /100 | #66 | Exceptional 48.3% |
| Slovaks | 98.2 /100 | #67 | Exceptional 48.3% |
| Immigrants | England | 98.2 /100 | #68 | Exceptional 48.3% |
| Canadians | 98.1 /100 | #69 | Exceptional 48.3% |
| Immigrants | Asia | 97.9 /100 | #70 | Exceptional 48.3% |
| Macedonians | 97.9 /100 | #71 | Exceptional 48.3% |
| Immigrants | Lebanon | 97.6 /100 | #72 | Exceptional 48.2% |
| Immigrants | Eastern Asia | 97.5 /100 | #73 | Exceptional 48.2% |
| Estonians | 97.4 /100 | #74 | Exceptional 48.2% |
| Immigrants | Belarus | 97.2 /100 | #75 | Exceptional 48.1% |
| Basques | 97.2 /100 | #76 | Exceptional 48.1% |
| Slovenes | 97.1 /100 | #77 | Exceptional 48.1% |
| Immigrants | Belgium | 97.1 /100 | #78 | Exceptional 48.1% |
| Immigrants | South Africa | 97.0 /100 | #79 | Exceptional 48.1% |
| Immigrants | Poland | 96.9 /100 | #80 | Exceptional 48.1% |