Immigrants from Haiti vs Immigrants from Afghanistan Currently Married
COMPARE
Immigrants from Haiti
Immigrants from Afghanistan
Currently Married
Currently Married Comparison
Immigrants from Haiti
Immigrants from Afghanistan
41.0%
CURRENTLY MARRIED
0.0/ 100
METRIC RATING
322nd/ 347
METRIC RANK
46.8%
CURRENTLY MARRIED
58.2/ 100
METRIC RATING
168th/ 347
METRIC RANK
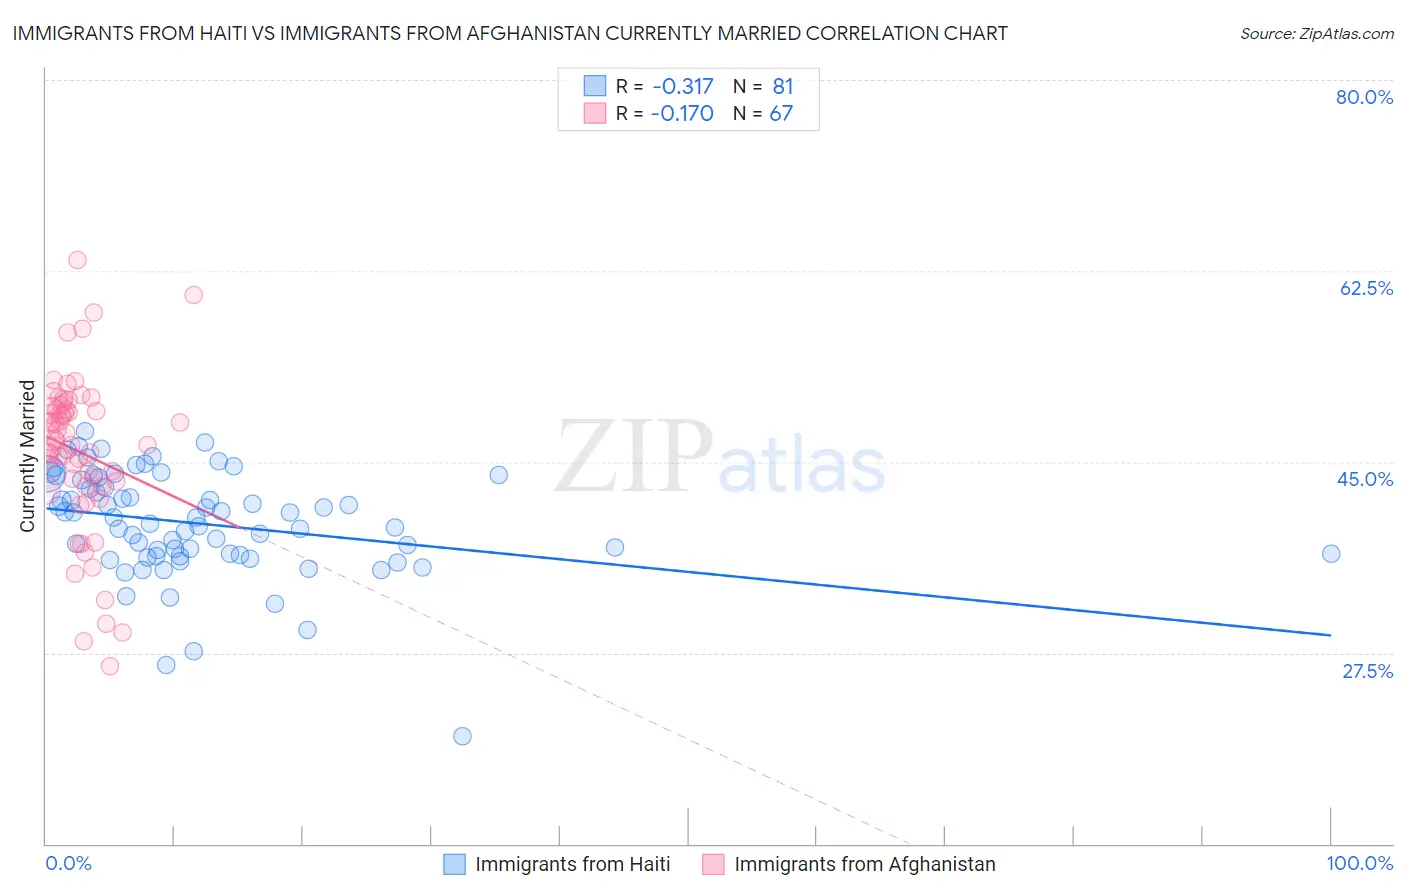
Immigrants from Haiti vs Immigrants from Afghanistan Currently Married Correlation Chart
The statistical analysis conducted on geographies consisting of 225,264,174 people shows a mild negative correlation between the proportion of Immigrants from Haiti and percentage of population currently married in the United States with a correlation coefficient (R) of -0.317 and weighted average of 41.0%. Similarly, the statistical analysis conducted on geographies consisting of 147,642,585 people shows a poor negative correlation between the proportion of Immigrants from Afghanistan and percentage of population currently married in the United States with a correlation coefficient (R) of -0.170 and weighted average of 46.8%, a difference of 14.1%.
Currently Married Correlation Summary
| Measurement | Immigrants from Haiti | Immigrants from Afghanistan |
| Minimum | 19.9% | 26.3% |
| Maximum | 47.8% | 63.5% |
| Range | 27.9% | 37.2% |
| Mean | 39.3% | 46.0% |
| Median | 39.9% | 46.9% |
| Interquartile 25% (IQ1) | 36.4% | 42.8% |
| Interquartile 75% (IQ3) | 43.5% | 50.1% |
| Interquartile Range (IQR) | 7.1% | 7.3% |
| Standard Deviation (Sample) | 4.9% | 7.2% |
| Standard Deviation (Population) | 4.9% | 7.2% |
Similar Demographics by Currently Married
Demographics Similar to Immigrants from Haiti by Currently Married
In terms of currently married, the demographic groups most similar to Immigrants from Haiti are Immigrants from Congo (41.1%, a difference of 0.13%), Immigrants from Jamaica (41.1%, a difference of 0.36%), Immigrants from Somalia (41.2%, a difference of 0.43%), Bahamian (41.2%, a difference of 0.44%), and Haitian (41.3%, a difference of 0.63%).
| Demographics | Rating | Rank | Currently Married |
| Inupiat | 0.0 /100 | #315 | Tragic 41.3% |
| Immigrants | Caribbean | 0.0 /100 | #316 | Tragic 41.3% |
| Haitians | 0.0 /100 | #317 | Tragic 41.3% |
| Bahamians | 0.0 /100 | #318 | Tragic 41.2% |
| Immigrants | Somalia | 0.0 /100 | #319 | Tragic 41.2% |
| Immigrants | Jamaica | 0.0 /100 | #320 | Tragic 41.1% |
| Immigrants | Congo | 0.0 /100 | #321 | Tragic 41.1% |
| Immigrants | Haiti | 0.0 /100 | #322 | Tragic 41.0% |
| Immigrants | West Indies | 0.0 /100 | #323 | Tragic 40.7% |
| Immigrants | Senegal | 0.0 /100 | #324 | Tragic 40.7% |
| U.S. Virgin Islanders | 0.0 /100 | #325 | Tragic 40.7% |
| Barbadians | 0.0 /100 | #326 | Tragic 40.6% |
| Senegalese | 0.0 /100 | #327 | Tragic 40.6% |
| Arapaho | 0.0 /100 | #328 | Tragic 40.5% |
| Crow | 0.0 /100 | #329 | Tragic 40.4% |
Demographics Similar to Immigrants from Afghanistan by Currently Married
In terms of currently married, the demographic groups most similar to Immigrants from Afghanistan are Armenian (46.8%, a difference of 0.0%), Spaniard (46.8%, a difference of 0.020%), Immigrants from Syria (46.8%, a difference of 0.040%), Samoan (46.8%, a difference of 0.060%), and Immigrants from Latvia (46.7%, a difference of 0.060%).
| Demographics | Rating | Rank | Currently Married |
| Immigrants | Southern Europe | 65.9 /100 | #161 | Good 46.9% |
| Immigrants | Nonimmigrants | 65.4 /100 | #162 | Good 46.9% |
| Delaware | 64.7 /100 | #163 | Good 46.9% |
| Immigrants | Western Asia | 64.2 /100 | #164 | Good 46.9% |
| Samoans | 59.8 /100 | #165 | Average 46.8% |
| Immigrants | Syria | 59.3 /100 | #166 | Average 46.8% |
| Spaniards | 58.8 /100 | #167 | Average 46.8% |
| Immigrants | Afghanistan | 58.2 /100 | #168 | Average 46.8% |
| Armenians | 58.2 /100 | #169 | Average 46.8% |
| Immigrants | Latvia | 56.7 /100 | #170 | Average 46.7% |
| Immigrants | Zimbabwe | 52.4 /100 | #171 | Average 46.7% |
| Aleuts | 52.0 /100 | #172 | Average 46.7% |
| Tlingit-Haida | 51.2 /100 | #173 | Average 46.7% |
| Peruvians | 50.0 /100 | #174 | Average 46.6% |
| Immigrants | Brazil | 49.9 /100 | #175 | Average 46.6% |