Tsimshian vs Trinidadian and Tobagonian Single Father Households
COMPARE
Tsimshian
Trinidadian and Tobagonian
Single Father Households
Single Father Households Comparison
Tsimshian
Trinidadians and Tobagonians
2.9%
SINGLE FATHER HOUSEHOLDS
0.0/ 100
METRIC RATING
312th/ 347
METRIC RANK
2.2%
SINGLE FATHER HOUSEHOLDS
97.8/ 100
METRIC RATING
119th/ 347
METRIC RANK
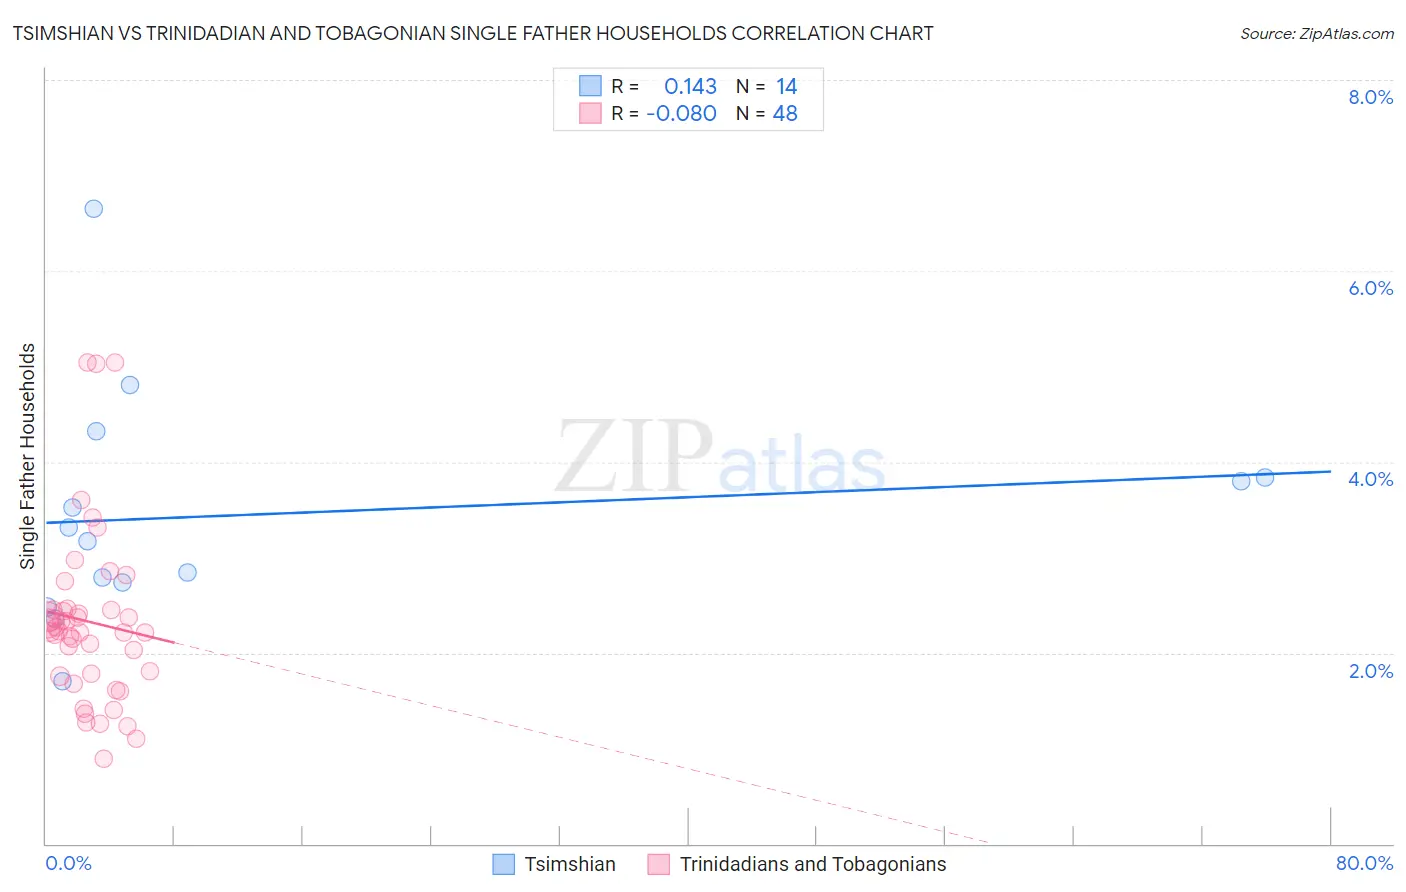
Tsimshian vs Trinidadian and Tobagonian Single Father Households Correlation Chart
The statistical analysis conducted on geographies consisting of 15,613,275 people shows a poor positive correlation between the proportion of Tsimshian and percentage of single father households in the United States with a correlation coefficient (R) of 0.143 and weighted average of 2.9%. Similarly, the statistical analysis conducted on geographies consisting of 218,763,381 people shows a slight negative correlation between the proportion of Trinidadians and Tobagonians and percentage of single father households in the United States with a correlation coefficient (R) of -0.080 and weighted average of 2.2%, a difference of 32.9%.
Single Father Households Correlation Summary
| Measurement | Tsimshian | Trinidadian and Tobagonian |
| Minimum | 1.7% | 0.89% |
| Maximum | 6.6% | 5.0% |
| Range | 4.9% | 4.2% |
| Mean | 3.5% | 2.3% |
| Median | 3.2% | 2.2% |
| Interquartile 25% (IQ1) | 2.7% | 1.8% |
| Interquartile 75% (IQ3) | 3.8% | 2.5% |
| Interquartile Range (IQR) | 1.1% | 0.69% |
| Standard Deviation (Sample) | 1.2% | 0.92% |
| Standard Deviation (Population) | 1.2% | 0.91% |
Similar Demographics by Single Father Households
Demographics Similar to Tsimshian by Single Father Households
In terms of single father households, the demographic groups most similar to Tsimshian are Arapaho (2.9%, a difference of 0.42%), Spanish American Indian (2.9%, a difference of 0.57%), Salvadoran (2.9%, a difference of 0.67%), Immigrants from Laos (2.9%, a difference of 1.1%), and Cheyenne (2.9%, a difference of 1.1%).
| Demographics | Rating | Rank | Single Father Households |
| Hispanics or Latinos | 0.0 /100 | #305 | Tragic 2.8% |
| Immigrants | Azores | 0.0 /100 | #306 | Tragic 2.8% |
| Hopi | 0.0 /100 | #307 | Tragic 2.8% |
| Apache | 0.0 /100 | #308 | Tragic 2.8% |
| Central Americans | 0.0 /100 | #309 | Tragic 2.9% |
| Immigrants | Laos | 0.0 /100 | #310 | Tragic 2.9% |
| Spanish American Indians | 0.0 /100 | #311 | Tragic 2.9% |
| Tsimshian | 0.0 /100 | #312 | Tragic 2.9% |
| Arapaho | 0.0 /100 | #313 | Tragic 2.9% |
| Salvadorans | 0.0 /100 | #314 | Tragic 2.9% |
| Cheyenne | 0.0 /100 | #315 | Tragic 2.9% |
| Houma | 0.0 /100 | #316 | Tragic 2.9% |
| Immigrants | El Salvador | 0.0 /100 | #317 | Tragic 2.9% |
| Cape Verdeans | 0.0 /100 | #318 | Tragic 2.9% |
| Ute | 0.0 /100 | #319 | Tragic 3.0% |
Demographics Similar to Trinidadians and Tobagonians by Single Father Households
In terms of single father households, the demographic groups most similar to Trinidadians and Tobagonians are Australian (2.2%, a difference of 0.030%), Immigrants from Brazil (2.2%, a difference of 0.040%), Immigrants from Morocco (2.2%, a difference of 0.060%), Immigrants from Iraq (2.2%, a difference of 0.13%), and Hungarian (2.2%, a difference of 0.16%).
| Demographics | Rating | Rank | Single Father Households |
| Immigrants | Trinidad and Tobago | 98.2 /100 | #112 | Exceptional 2.2% |
| Iraqis | 98.2 /100 | #113 | Exceptional 2.2% |
| Immigrants | North America | 98.2 /100 | #114 | Exceptional 2.2% |
| Immigrants | Barbados | 98.2 /100 | #115 | Exceptional 2.2% |
| Immigrants | Argentina | 98.1 /100 | #116 | Exceptional 2.2% |
| Hungarians | 97.9 /100 | #117 | Exceptional 2.2% |
| Immigrants | Morocco | 97.8 /100 | #118 | Exceptional 2.2% |
| Trinidadians and Tobagonians | 97.8 /100 | #119 | Exceptional 2.2% |
| Australians | 97.7 /100 | #120 | Exceptional 2.2% |
| Immigrants | Brazil | 97.7 /100 | #121 | Exceptional 2.2% |
| Immigrants | Iraq | 97.6 /100 | #122 | Exceptional 2.2% |
| Immigrants | Yemen | 97.5 /100 | #123 | Exceptional 2.2% |
| British West Indians | 97.4 /100 | #124 | Exceptional 2.2% |
| Immigrants | Indonesia | 97.4 /100 | #125 | Exceptional 2.2% |
| Moroccans | 96.9 /100 | #126 | Exceptional 2.2% |