Croatian vs Creek Single Father Households
COMPARE
Croatian
Creek
Single Father Households
Single Father Households Comparison
Croatians
Creek
2.1%
SINGLE FATHER HOUSEHOLDS
99.3/ 100
METRIC RATING
93rd/ 347
METRIC RANK
2.6%
SINGLE FATHER HOUSEHOLDS
0.2/ 100
METRIC RATING
271st/ 347
METRIC RANK
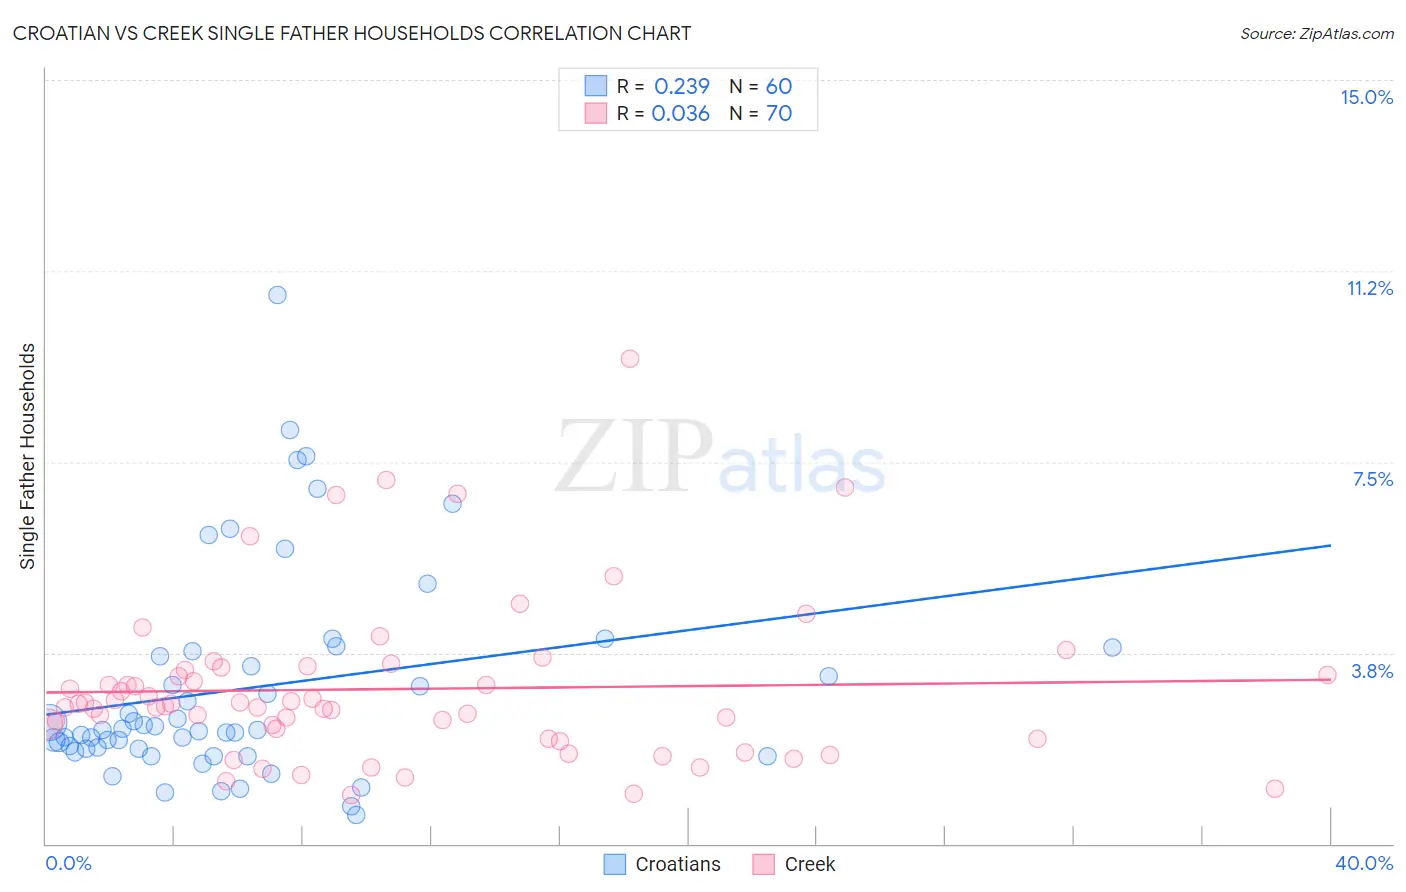
Croatian vs Creek Single Father Households Correlation Chart
The statistical analysis conducted on geographies consisting of 372,052,668 people shows a weak positive correlation between the proportion of Croatians and percentage of single father households in the United States with a correlation coefficient (R) of 0.239 and weighted average of 2.1%. Similarly, the statistical analysis conducted on geographies consisting of 177,693,364 people shows no correlation between the proportion of Creek and percentage of single father households in the United States with a correlation coefficient (R) of 0.036 and weighted average of 2.6%, a difference of 22.5%.
Single Father Households Correlation Summary
| Measurement | Croatian | Creek |
| Minimum | 0.56% | 0.96% |
| Maximum | 10.8% | 9.5% |
| Range | 10.2% | 8.6% |
| Mean | 3.1% | 3.0% |
| Median | 2.2% | 2.7% |
| Interquartile 25% (IQ1) | 1.9% | 2.1% |
| Interquartile 75% (IQ3) | 3.7% | 3.4% |
| Interquartile Range (IQR) | 1.9% | 1.3% |
| Standard Deviation (Sample) | 2.1% | 1.6% |
| Standard Deviation (Population) | 2.1% | 1.6% |
Similar Demographics by Single Father Households
Demographics Similar to Croatians by Single Father Households
In terms of single father households, the demographic groups most similar to Croatians are Ukrainian (2.1%, a difference of 0.0%), Romanian (2.1%, a difference of 0.11%), Immigrants from Guyana (2.1%, a difference of 0.20%), Bermudan (2.1%, a difference of 0.23%), and Arab (2.1%, a difference of 0.37%).
| Demographics | Rating | Rank | Single Father Households |
| Asians | 99.6 /100 | #86 | Exceptional 2.1% |
| Lithuanians | 99.5 /100 | #87 | Exceptional 2.1% |
| Bhutanese | 99.5 /100 | #88 | Exceptional 2.1% |
| Immigrants | Armenia | 99.5 /100 | #89 | Exceptional 2.1% |
| Immigrants | Pakistan | 99.5 /100 | #90 | Exceptional 2.1% |
| Immigrants | Guyana | 99.4 /100 | #91 | Exceptional 2.1% |
| Romanians | 99.4 /100 | #92 | Exceptional 2.1% |
| Croatians | 99.3 /100 | #93 | Exceptional 2.1% |
| Ukrainians | 99.3 /100 | #94 | Exceptional 2.1% |
| Bermudans | 99.2 /100 | #95 | Exceptional 2.1% |
| Arabs | 99.2 /100 | #96 | Exceptional 2.1% |
| Immigrants | Moldova | 99.1 /100 | #97 | Exceptional 2.1% |
| Guyanese | 99.1 /100 | #98 | Exceptional 2.1% |
| South Africans | 99.1 /100 | #99 | Exceptional 2.1% |
| Immigrants | Northern Africa | 99.0 /100 | #100 | Exceptional 2.1% |
Demographics Similar to Creek by Single Father Households
In terms of single father households, the demographic groups most similar to Creek are Belizean (2.6%, a difference of 0.0%), Iroquois (2.6%, a difference of 0.050%), Puerto Rican (2.6%, a difference of 0.070%), Seminole (2.6%, a difference of 0.36%), and Cuban (2.6%, a difference of 0.50%).
| Demographics | Rating | Rank | Single Father Households |
| Indonesians | 0.5 /100 | #264 | Tragic 2.6% |
| Immigrants | Micronesia | 0.5 /100 | #265 | Tragic 2.6% |
| French American Indians | 0.5 /100 | #266 | Tragic 2.6% |
| Guamanians/Chamorros | 0.4 /100 | #267 | Tragic 2.6% |
| Haitians | 0.4 /100 | #268 | Tragic 2.6% |
| Cubans | 0.3 /100 | #269 | Tragic 2.6% |
| Seminole | 0.3 /100 | #270 | Tragic 2.6% |
| Creek | 0.2 /100 | #271 | Tragic 2.6% |
| Belizeans | 0.2 /100 | #272 | Tragic 2.6% |
| Iroquois | 0.2 /100 | #273 | Tragic 2.6% |
| Puerto Ricans | 0.2 /100 | #274 | Tragic 2.6% |
| Immigrants | Dominican Republic | 0.2 /100 | #275 | Tragic 2.6% |
| Immigrants | Haiti | 0.1 /100 | #276 | Tragic 2.6% |
| Shoshone | 0.1 /100 | #277 | Tragic 2.6% |
| Cherokee | 0.1 /100 | #278 | Tragic 2.6% |