Croatian vs Immigrants from Zimbabwe Single Father Households
COMPARE
Croatian
Immigrants from Zimbabwe
Single Father Households
Single Father Households Comparison
Croatians
Immigrants from Zimbabwe
2.1%
SINGLE FATHER HOUSEHOLDS
99.3/ 100
METRIC RATING
93rd/ 347
METRIC RANK
2.2%
SINGLE FATHER HOUSEHOLDS
90.2/ 100
METRIC RATING
145th/ 347
METRIC RANK
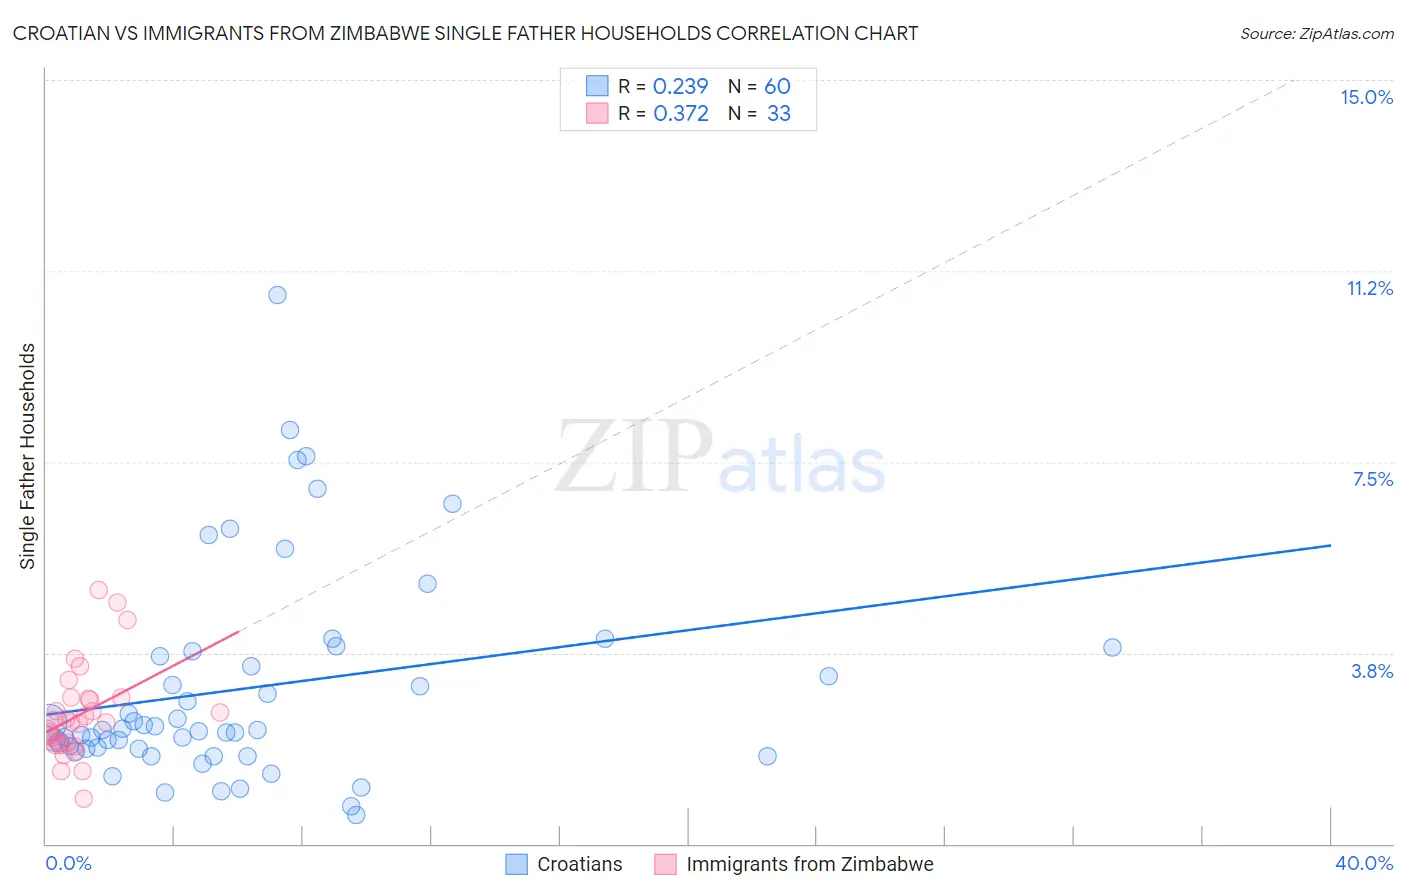
Croatian vs Immigrants from Zimbabwe Single Father Households Correlation Chart
The statistical analysis conducted on geographies consisting of 372,052,668 people shows a weak positive correlation between the proportion of Croatians and percentage of single father households in the United States with a correlation coefficient (R) of 0.239 and weighted average of 2.1%. Similarly, the statistical analysis conducted on geographies consisting of 117,591,458 people shows a mild positive correlation between the proportion of Immigrants from Zimbabwe and percentage of single father households in the United States with a correlation coefficient (R) of 0.372 and weighted average of 2.2%, a difference of 5.6%.
Single Father Households Correlation Summary
| Measurement | Croatian | Immigrants from Zimbabwe |
| Minimum | 0.56% | 0.87% |
| Maximum | 10.8% | 5.0% |
| Range | 10.2% | 4.1% |
| Mean | 3.1% | 2.5% |
| Median | 2.2% | 2.4% |
| Interquartile 25% (IQ1) | 1.9% | 2.0% |
| Interquartile 75% (IQ3) | 3.7% | 2.9% |
| Interquartile Range (IQR) | 1.9% | 0.89% |
| Standard Deviation (Sample) | 2.1% | 0.90% |
| Standard Deviation (Population) | 2.1% | 0.89% |
Similar Demographics by Single Father Households
Demographics Similar to Croatians by Single Father Households
In terms of single father households, the demographic groups most similar to Croatians are Ukrainian (2.1%, a difference of 0.0%), Romanian (2.1%, a difference of 0.11%), Immigrants from Guyana (2.1%, a difference of 0.20%), Bermudan (2.1%, a difference of 0.23%), and Arab (2.1%, a difference of 0.37%).
| Demographics | Rating | Rank | Single Father Households |
| Asians | 99.6 /100 | #86 | Exceptional 2.1% |
| Lithuanians | 99.5 /100 | #87 | Exceptional 2.1% |
| Bhutanese | 99.5 /100 | #88 | Exceptional 2.1% |
| Immigrants | Armenia | 99.5 /100 | #89 | Exceptional 2.1% |
| Immigrants | Pakistan | 99.5 /100 | #90 | Exceptional 2.1% |
| Immigrants | Guyana | 99.4 /100 | #91 | Exceptional 2.1% |
| Romanians | 99.4 /100 | #92 | Exceptional 2.1% |
| Croatians | 99.3 /100 | #93 | Exceptional 2.1% |
| Ukrainians | 99.3 /100 | #94 | Exceptional 2.1% |
| Bermudans | 99.2 /100 | #95 | Exceptional 2.1% |
| Arabs | 99.2 /100 | #96 | Exceptional 2.1% |
| Immigrants | Moldova | 99.1 /100 | #97 | Exceptional 2.1% |
| Guyanese | 99.1 /100 | #98 | Exceptional 2.1% |
| South Africans | 99.1 /100 | #99 | Exceptional 2.1% |
| Immigrants | Northern Africa | 99.0 /100 | #100 | Exceptional 2.1% |
Demographics Similar to Immigrants from Zimbabwe by Single Father Households
In terms of single father households, the demographic groups most similar to Immigrants from Zimbabwe are Northern European (2.2%, a difference of 0.080%), Slovak (2.2%, a difference of 0.11%), Slavic (2.2%, a difference of 0.26%), South American Indian (2.3%, a difference of 0.35%), and Senegalese (2.3%, a difference of 0.36%).
| Demographics | Rating | Rank | Single Father Households |
| West Indians | 94.1 /100 | #138 | Exceptional 2.2% |
| Brazilians | 92.8 /100 | #139 | Exceptional 2.2% |
| British | 92.8 /100 | #140 | Exceptional 2.2% |
| Laotians | 92.5 /100 | #141 | Exceptional 2.2% |
| Luxembourgers | 92.3 /100 | #142 | Exceptional 2.2% |
| Immigrants | Nepal | 92.1 /100 | #143 | Exceptional 2.2% |
| Slovaks | 90.7 /100 | #144 | Exceptional 2.2% |
| Immigrants | Zimbabwe | 90.2 /100 | #145 | Exceptional 2.2% |
| Northern Europeans | 89.8 /100 | #146 | Excellent 2.2% |
| Slavs | 88.9 /100 | #147 | Excellent 2.2% |
| South American Indians | 88.5 /100 | #148 | Excellent 2.3% |
| Senegalese | 88.4 /100 | #149 | Excellent 2.3% |
| Venezuelans | 86.2 /100 | #150 | Excellent 2.3% |
| Immigrants | Syria | 84.8 /100 | #151 | Excellent 2.3% |
| Immigrants | Venezuela | 83.2 /100 | #152 | Excellent 2.3% |