Croatian vs Ecuadorian Single Father Households
COMPARE
Croatian
Ecuadorian
Single Father Households
Single Father Households Comparison
Croatians
Ecuadorians
2.1%
SINGLE FATHER HOUSEHOLDS
99.3/ 100
METRIC RATING
93rd/ 347
METRIC RANK
2.4%
SINGLE FATHER HOUSEHOLDS
24.5/ 100
METRIC RATING
204th/ 347
METRIC RANK
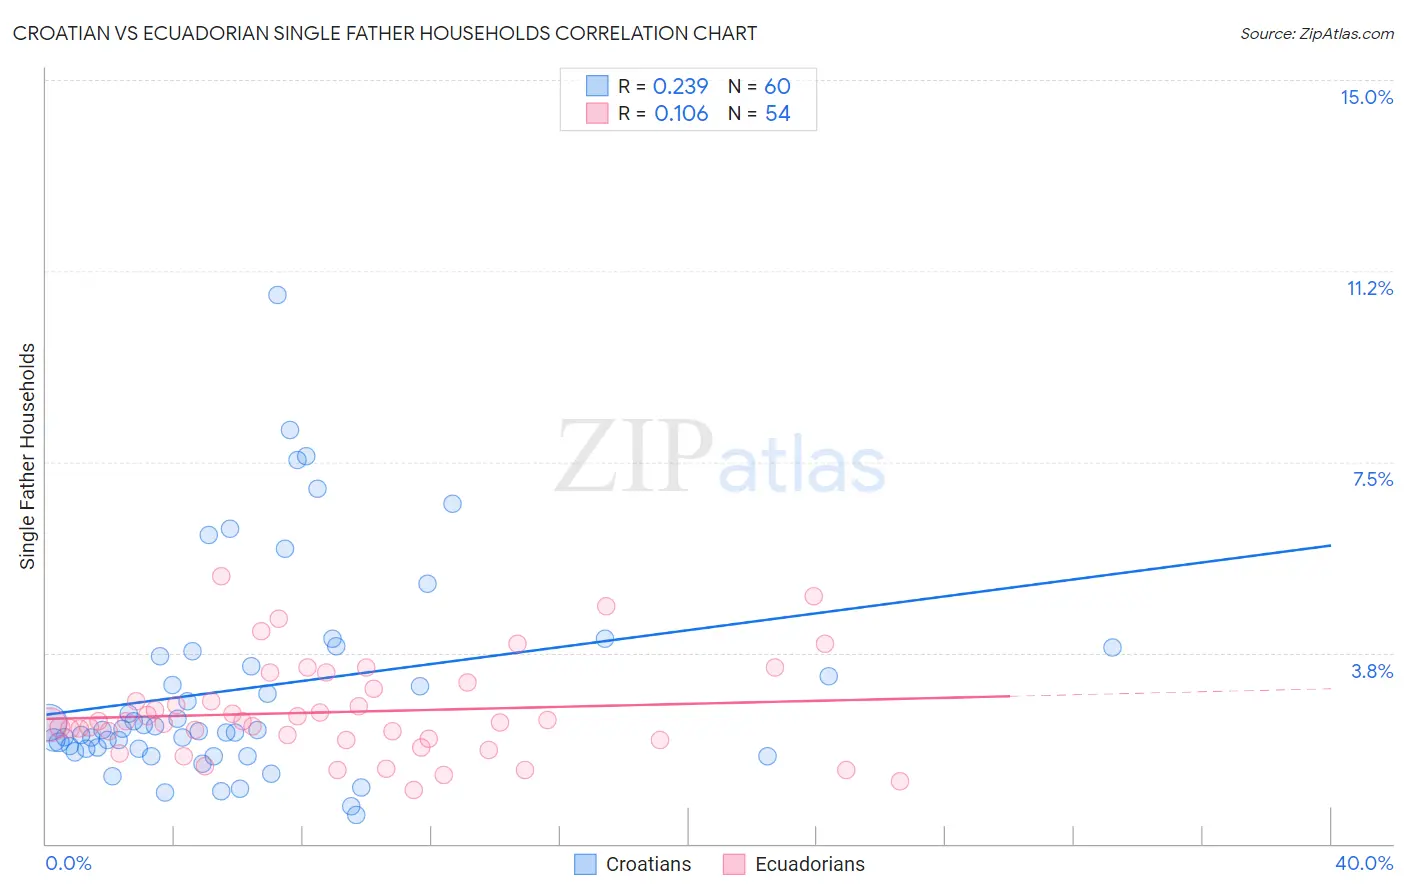
Croatian vs Ecuadorian Single Father Households Correlation Chart
The statistical analysis conducted on geographies consisting of 372,052,668 people shows a weak positive correlation between the proportion of Croatians and percentage of single father households in the United States with a correlation coefficient (R) of 0.239 and weighted average of 2.1%. Similarly, the statistical analysis conducted on geographies consisting of 315,595,316 people shows a poor positive correlation between the proportion of Ecuadorians and percentage of single father households in the United States with a correlation coefficient (R) of 0.106 and weighted average of 2.4%, a difference of 12.4%.
Single Father Households Correlation Summary
| Measurement | Croatian | Ecuadorian |
| Minimum | 0.56% | 1.1% |
| Maximum | 10.8% | 5.3% |
| Range | 10.2% | 4.2% |
| Mean | 3.1% | 2.6% |
| Median | 2.2% | 2.4% |
| Interquartile 25% (IQ1) | 1.9% | 2.0% |
| Interquartile 75% (IQ3) | 3.7% | 3.0% |
| Interquartile Range (IQR) | 1.9% | 1.0% |
| Standard Deviation (Sample) | 2.1% | 0.94% |
| Standard Deviation (Population) | 2.1% | 0.93% |
Similar Demographics by Single Father Households
Demographics Similar to Croatians by Single Father Households
In terms of single father households, the demographic groups most similar to Croatians are Ukrainian (2.1%, a difference of 0.0%), Romanian (2.1%, a difference of 0.11%), Immigrants from Guyana (2.1%, a difference of 0.20%), Bermudan (2.1%, a difference of 0.23%), and Arab (2.1%, a difference of 0.37%).
| Demographics | Rating | Rank | Single Father Households |
| Asians | 99.6 /100 | #86 | Exceptional 2.1% |
| Lithuanians | 99.5 /100 | #87 | Exceptional 2.1% |
| Bhutanese | 99.5 /100 | #88 | Exceptional 2.1% |
| Immigrants | Armenia | 99.5 /100 | #89 | Exceptional 2.1% |
| Immigrants | Pakistan | 99.5 /100 | #90 | Exceptional 2.1% |
| Immigrants | Guyana | 99.4 /100 | #91 | Exceptional 2.1% |
| Romanians | 99.4 /100 | #92 | Exceptional 2.1% |
| Croatians | 99.3 /100 | #93 | Exceptional 2.1% |
| Ukrainians | 99.3 /100 | #94 | Exceptional 2.1% |
| Bermudans | 99.2 /100 | #95 | Exceptional 2.1% |
| Arabs | 99.2 /100 | #96 | Exceptional 2.1% |
| Immigrants | Moldova | 99.1 /100 | #97 | Exceptional 2.1% |
| Guyanese | 99.1 /100 | #98 | Exceptional 2.1% |
| South Africans | 99.1 /100 | #99 | Exceptional 2.1% |
| Immigrants | Northern Africa | 99.0 /100 | #100 | Exceptional 2.1% |
Demographics Similar to Ecuadorians by Single Father Households
In terms of single father households, the demographic groups most similar to Ecuadorians are French Canadian (2.4%, a difference of 0.020%), Immigrants from Afghanistan (2.4%, a difference of 0.030%), Korean (2.4%, a difference of 0.030%), German Russian (2.4%, a difference of 0.12%), and Immigrants from Uganda (2.4%, a difference of 0.15%).
| Demographics | Rating | Rank | Single Father Households |
| Germans | 28.0 /100 | #197 | Fair 2.4% |
| Scandinavians | 27.4 /100 | #198 | Fair 2.4% |
| Immigrants | Vietnam | 27.1 /100 | #199 | Fair 2.4% |
| Peruvians | 27.1 /100 | #200 | Fair 2.4% |
| Immigrants | Uganda | 26.0 /100 | #201 | Fair 2.4% |
| German Russians | 25.7 /100 | #202 | Fair 2.4% |
| French Canadians | 24.7 /100 | #203 | Fair 2.4% |
| Ecuadorians | 24.5 /100 | #204 | Fair 2.4% |
| Immigrants | Afghanistan | 24.2 /100 | #205 | Fair 2.4% |
| Koreans | 24.1 /100 | #206 | Fair 2.4% |
| Whites/Caucasians | 22.6 /100 | #207 | Fair 2.4% |
| Immigrants | Kenya | 20.3 /100 | #208 | Fair 2.4% |
| Immigrants | Peru | 19.3 /100 | #209 | Poor 2.4% |
| Immigrants | Costa Rica | 19.2 /100 | #210 | Poor 2.4% |
| Immigrants | Nigeria | 18.7 /100 | #211 | Poor 2.4% |