Norwegian vs Trinidadian and Tobagonian Single Father Households
COMPARE
Norwegian
Trinidadian and Tobagonian
Single Father Households
Single Father Households Comparison
Norwegians
Trinidadians and Tobagonians
2.4%
SINGLE FATHER HOUSEHOLDS
17.1/ 100
METRIC RATING
213th/ 347
METRIC RANK
2.2%
SINGLE FATHER HOUSEHOLDS
97.8/ 100
METRIC RATING
119th/ 347
METRIC RANK
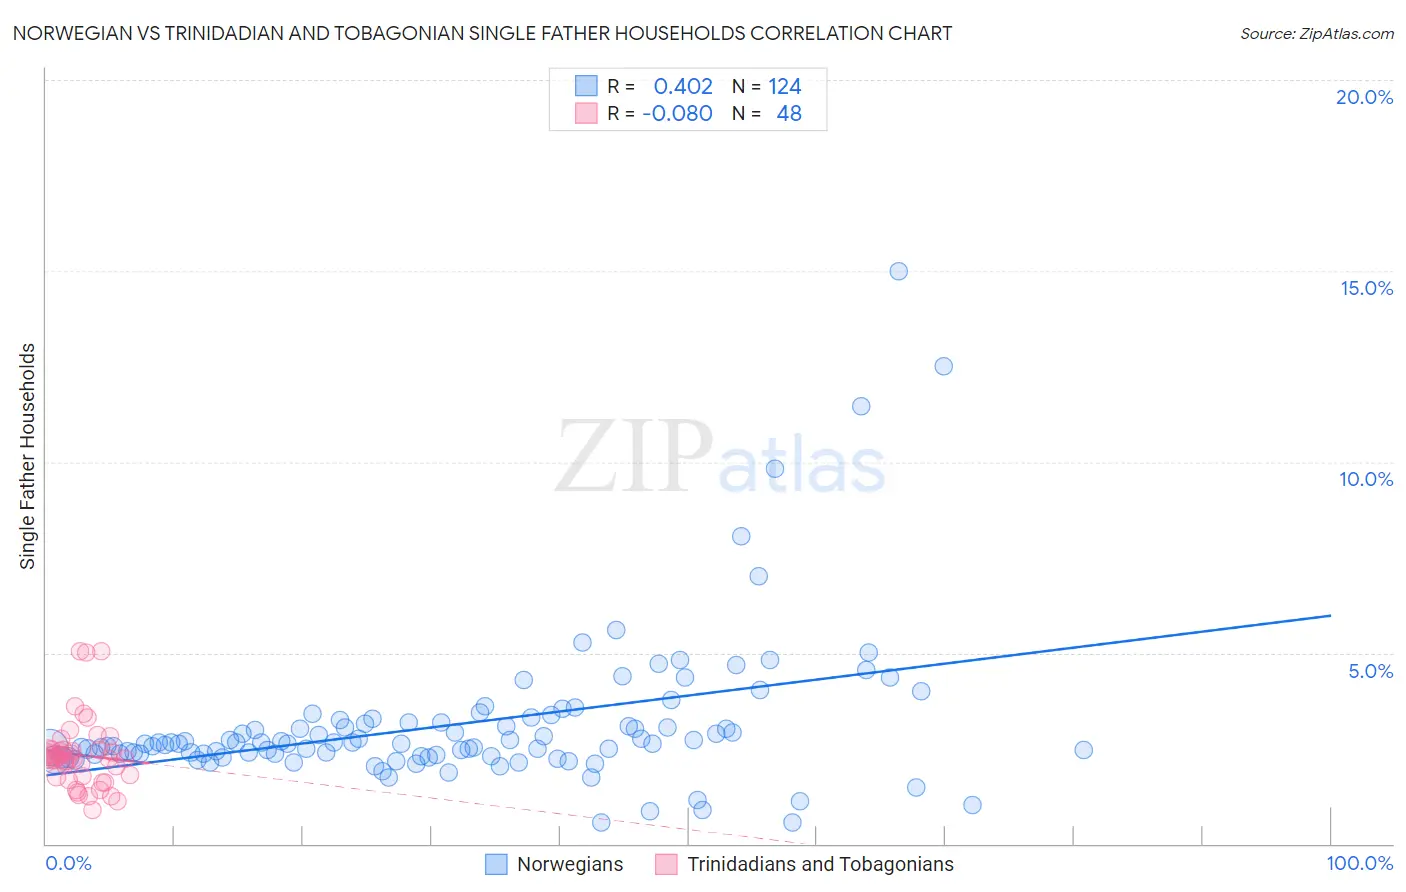
Norwegian vs Trinidadian and Tobagonian Single Father Households Correlation Chart
The statistical analysis conducted on geographies consisting of 522,435,304 people shows a moderate positive correlation between the proportion of Norwegians and percentage of single father households in the United States with a correlation coefficient (R) of 0.402 and weighted average of 2.4%. Similarly, the statistical analysis conducted on geographies consisting of 218,763,381 people shows a slight negative correlation between the proportion of Trinidadians and Tobagonians and percentage of single father households in the United States with a correlation coefficient (R) of -0.080 and weighted average of 2.2%, a difference of 10.6%.
Single Father Households Correlation Summary
| Measurement | Norwegian | Trinidadian and Tobagonian |
| Minimum | 0.55% | 0.89% |
| Maximum | 15.0% | 5.0% |
| Range | 14.5% | 4.2% |
| Mean | 3.1% | 2.3% |
| Median | 2.6% | 2.2% |
| Interquartile 25% (IQ1) | 2.3% | 1.8% |
| Interquartile 75% (IQ3) | 3.2% | 2.5% |
| Interquartile Range (IQR) | 0.86% | 0.69% |
| Standard Deviation (Sample) | 2.0% | 0.92% |
| Standard Deviation (Population) | 2.0% | 0.91% |
Similar Demographics by Single Father Households
Demographics Similar to Norwegians by Single Father Households
In terms of single father households, the demographic groups most similar to Norwegians are Ethiopian (2.4%, a difference of 0.060%), Finnish (2.4%, a difference of 0.15%), Immigrants from South Eastern Asia (2.4%, a difference of 0.16%), Immigrants from Nigeria (2.4%, a difference of 0.20%), and Immigrants from Costa Rica (2.4%, a difference of 0.25%).
| Demographics | Rating | Rank | Single Father Households |
| Koreans | 24.1 /100 | #206 | Fair 2.4% |
| Whites/Caucasians | 22.6 /100 | #207 | Fair 2.4% |
| Immigrants | Kenya | 20.3 /100 | #208 | Fair 2.4% |
| Immigrants | Peru | 19.3 /100 | #209 | Poor 2.4% |
| Immigrants | Costa Rica | 19.2 /100 | #210 | Poor 2.4% |
| Immigrants | Nigeria | 18.7 /100 | #211 | Poor 2.4% |
| Finns | 18.3 /100 | #212 | Poor 2.4% |
| Norwegians | 17.1 /100 | #213 | Poor 2.4% |
| Ethiopians | 16.6 /100 | #214 | Poor 2.4% |
| Immigrants | South Eastern Asia | 15.9 /100 | #215 | Poor 2.4% |
| Immigrants | Ecuador | 14.9 /100 | #216 | Poor 2.4% |
| Dutch | 14.3 /100 | #217 | Poor 2.4% |
| Immigrants | Ethiopia | 13.4 /100 | #218 | Poor 2.4% |
| Sudanese | 13.0 /100 | #219 | Poor 2.4% |
| Ghanaians | 12.9 /100 | #220 | Poor 2.4% |
Demographics Similar to Trinidadians and Tobagonians by Single Father Households
In terms of single father households, the demographic groups most similar to Trinidadians and Tobagonians are Australian (2.2%, a difference of 0.030%), Immigrants from Brazil (2.2%, a difference of 0.040%), Immigrants from Morocco (2.2%, a difference of 0.060%), Immigrants from Iraq (2.2%, a difference of 0.13%), and Hungarian (2.2%, a difference of 0.16%).
| Demographics | Rating | Rank | Single Father Households |
| Immigrants | Trinidad and Tobago | 98.2 /100 | #112 | Exceptional 2.2% |
| Iraqis | 98.2 /100 | #113 | Exceptional 2.2% |
| Immigrants | North America | 98.2 /100 | #114 | Exceptional 2.2% |
| Immigrants | Barbados | 98.2 /100 | #115 | Exceptional 2.2% |
| Immigrants | Argentina | 98.1 /100 | #116 | Exceptional 2.2% |
| Hungarians | 97.9 /100 | #117 | Exceptional 2.2% |
| Immigrants | Morocco | 97.8 /100 | #118 | Exceptional 2.2% |
| Trinidadians and Tobagonians | 97.8 /100 | #119 | Exceptional 2.2% |
| Australians | 97.7 /100 | #120 | Exceptional 2.2% |
| Immigrants | Brazil | 97.7 /100 | #121 | Exceptional 2.2% |
| Immigrants | Iraq | 97.6 /100 | #122 | Exceptional 2.2% |
| Immigrants | Yemen | 97.5 /100 | #123 | Exceptional 2.2% |
| British West Indians | 97.4 /100 | #124 | Exceptional 2.2% |
| Immigrants | Indonesia | 97.4 /100 | #125 | Exceptional 2.2% |
| Moroccans | 96.9 /100 | #126 | Exceptional 2.2% |