Croatian vs Welsh Single Father Households
COMPARE
Croatian
Welsh
Single Father Households
Single Father Households Comparison
Croatians
Welsh
2.1%
SINGLE FATHER HOUSEHOLDS
99.3/ 100
METRIC RATING
93rd/ 347
METRIC RANK
2.3%
SINGLE FATHER HOUSEHOLDS
44.0/ 100
METRIC RATING
179th/ 347
METRIC RANK
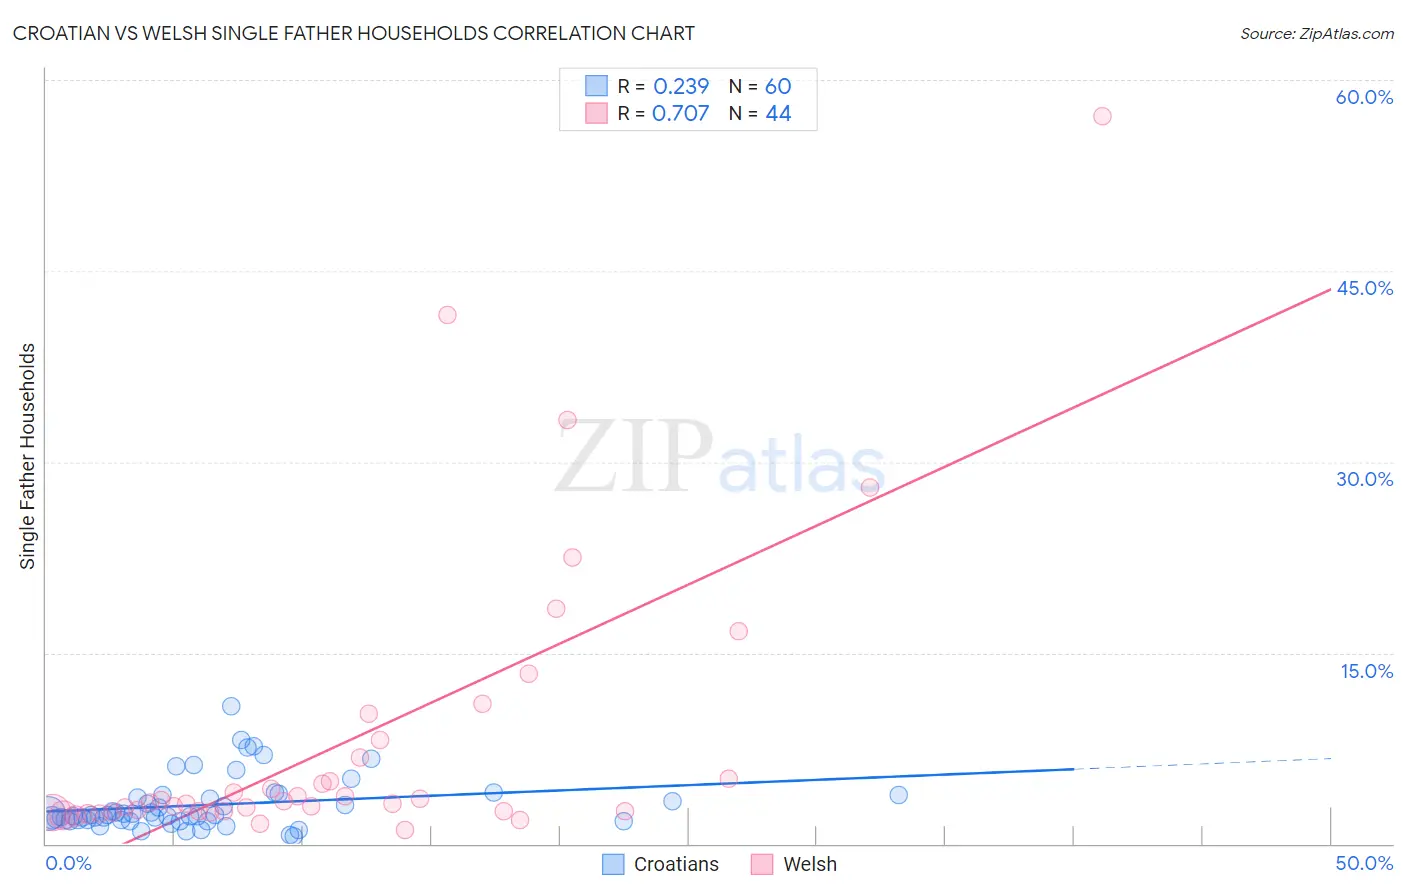
Croatian vs Welsh Single Father Households Correlation Chart
The statistical analysis conducted on geographies consisting of 372,052,668 people shows a weak positive correlation between the proportion of Croatians and percentage of single father households in the United States with a correlation coefficient (R) of 0.239 and weighted average of 2.1%. Similarly, the statistical analysis conducted on geographies consisting of 518,370,143 people shows a strong positive correlation between the proportion of Welsh and percentage of single father households in the United States with a correlation coefficient (R) of 0.707 and weighted average of 2.3%, a difference of 10.6%.
Single Father Households Correlation Summary
| Measurement | Croatian | Welsh |
| Minimum | 0.56% | 1.1% |
| Maximum | 10.8% | 57.1% |
| Range | 10.2% | 56.0% |
| Mean | 3.1% | 8.3% |
| Median | 2.2% | 3.3% |
| Interquartile 25% (IQ1) | 1.9% | 2.6% |
| Interquartile 75% (IQ3) | 3.7% | 7.5% |
| Interquartile Range (IQR) | 1.9% | 4.9% |
| Standard Deviation (Sample) | 2.1% | 11.7% |
| Standard Deviation (Population) | 2.1% | 11.5% |
Similar Demographics by Single Father Households
Demographics Similar to Croatians by Single Father Households
In terms of single father households, the demographic groups most similar to Croatians are Ukrainian (2.1%, a difference of 0.0%), Romanian (2.1%, a difference of 0.11%), Immigrants from Guyana (2.1%, a difference of 0.20%), Bermudan (2.1%, a difference of 0.23%), and Arab (2.1%, a difference of 0.37%).
| Demographics | Rating | Rank | Single Father Households |
| Asians | 99.6 /100 | #86 | Exceptional 2.1% |
| Lithuanians | 99.5 /100 | #87 | Exceptional 2.1% |
| Bhutanese | 99.5 /100 | #88 | Exceptional 2.1% |
| Immigrants | Armenia | 99.5 /100 | #89 | Exceptional 2.1% |
| Immigrants | Pakistan | 99.5 /100 | #90 | Exceptional 2.1% |
| Immigrants | Guyana | 99.4 /100 | #91 | Exceptional 2.1% |
| Romanians | 99.4 /100 | #92 | Exceptional 2.1% |
| Croatians | 99.3 /100 | #93 | Exceptional 2.1% |
| Ukrainians | 99.3 /100 | #94 | Exceptional 2.1% |
| Bermudans | 99.2 /100 | #95 | Exceptional 2.1% |
| Arabs | 99.2 /100 | #96 | Exceptional 2.1% |
| Immigrants | Moldova | 99.1 /100 | #97 | Exceptional 2.1% |
| Guyanese | 99.1 /100 | #98 | Exceptional 2.1% |
| South Africans | 99.1 /100 | #99 | Exceptional 2.1% |
| Immigrants | Northern Africa | 99.0 /100 | #100 | Exceptional 2.1% |
Demographics Similar to Welsh by Single Father Households
In terms of single father households, the demographic groups most similar to Welsh are Costa Rican (2.3%, a difference of 0.0%), Yugoslavian (2.3%, a difference of 0.010%), Jamaican (2.3%, a difference of 0.040%), Belgian (2.3%, a difference of 0.060%), and Immigrants from Panama (2.4%, a difference of 0.16%).
| Demographics | Rating | Rank | Single Father Households |
| Czechoslovakians | 58.9 /100 | #172 | Average 2.3% |
| Celtics | 55.4 /100 | #173 | Average 2.3% |
| Afghans | 50.0 /100 | #174 | Average 2.3% |
| Immigrants | Jamaica | 49.1 /100 | #175 | Average 2.3% |
| Danes | 48.2 /100 | #176 | Average 2.3% |
| Colombians | 48.0 /100 | #177 | Average 2.3% |
| Costa Ricans | 44.1 /100 | #178 | Average 2.3% |
| Welsh | 44.0 /100 | #179 | Average 2.3% |
| Yugoslavians | 43.9 /100 | #180 | Average 2.3% |
| Jamaicans | 43.5 /100 | #181 | Average 2.3% |
| Belgians | 43.3 /100 | #182 | Average 2.3% |
| Immigrants | Panama | 41.8 /100 | #183 | Average 2.4% |
| Sri Lankans | 41.8 /100 | #184 | Average 2.4% |
| Nigerians | 41.0 /100 | #185 | Average 2.4% |
| Immigrants | Bosnia and Herzegovina | 40.4 /100 | #186 | Average 2.4% |