Croatian vs Immigrants from Liberia Single Father Households
COMPARE
Croatian
Immigrants from Liberia
Single Father Households
Single Father Households Comparison
Croatians
Immigrants from Liberia
2.1%
SINGLE FATHER HOUSEHOLDS
99.3/ 100
METRIC RATING
93rd/ 347
METRIC RANK
2.5%
SINGLE FATHER HOUSEHOLDS
0.8/ 100
METRIC RATING
262nd/ 347
METRIC RANK
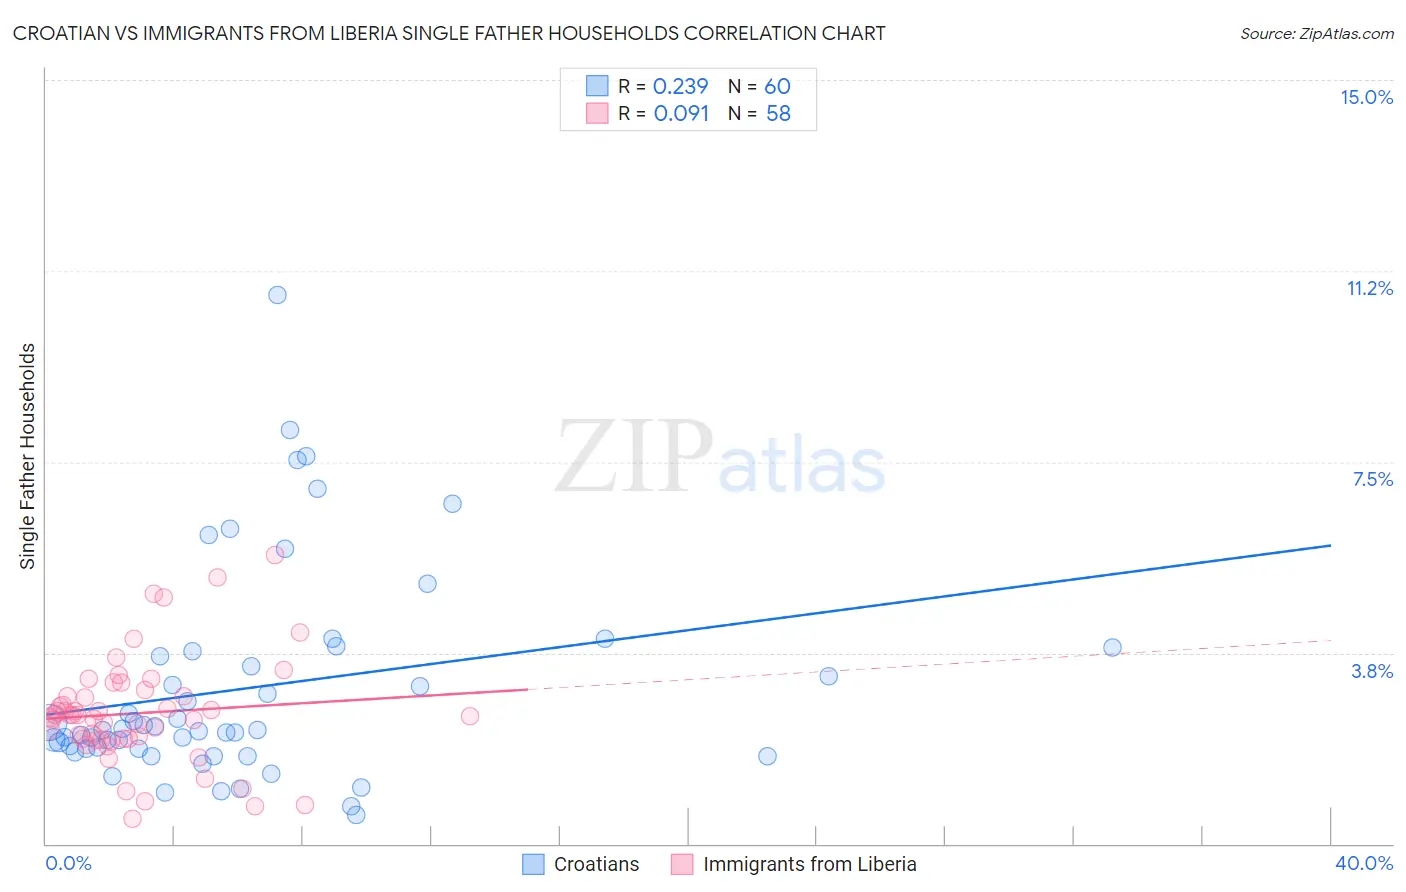
Croatian vs Immigrants from Liberia Single Father Households Correlation Chart
The statistical analysis conducted on geographies consisting of 372,052,668 people shows a weak positive correlation between the proportion of Croatians and percentage of single father households in the United States with a correlation coefficient (R) of 0.239 and weighted average of 2.1%. Similarly, the statistical analysis conducted on geographies consisting of 135,021,934 people shows a slight positive correlation between the proportion of Immigrants from Liberia and percentage of single father households in the United States with a correlation coefficient (R) of 0.091 and weighted average of 2.5%, a difference of 19.8%.
Single Father Households Correlation Summary
| Measurement | Croatian | Immigrants from Liberia |
| Minimum | 0.56% | 0.48% |
| Maximum | 10.8% | 5.7% |
| Range | 10.2% | 5.2% |
| Mean | 3.1% | 2.6% |
| Median | 2.2% | 2.5% |
| Interquartile 25% (IQ1) | 1.9% | 2.1% |
| Interquartile 75% (IQ3) | 3.7% | 2.9% |
| Interquartile Range (IQR) | 1.9% | 0.86% |
| Standard Deviation (Sample) | 2.1% | 1.0% |
| Standard Deviation (Population) | 2.1% | 1.0% |
Similar Demographics by Single Father Households
Demographics Similar to Croatians by Single Father Households
In terms of single father households, the demographic groups most similar to Croatians are Ukrainian (2.1%, a difference of 0.0%), Romanian (2.1%, a difference of 0.11%), Immigrants from Guyana (2.1%, a difference of 0.20%), Bermudan (2.1%, a difference of 0.23%), and Arab (2.1%, a difference of 0.37%).
| Demographics | Rating | Rank | Single Father Households |
| Asians | 99.6 /100 | #86 | Exceptional 2.1% |
| Lithuanians | 99.5 /100 | #87 | Exceptional 2.1% |
| Bhutanese | 99.5 /100 | #88 | Exceptional 2.1% |
| Immigrants | Armenia | 99.5 /100 | #89 | Exceptional 2.1% |
| Immigrants | Pakistan | 99.5 /100 | #90 | Exceptional 2.1% |
| Immigrants | Guyana | 99.4 /100 | #91 | Exceptional 2.1% |
| Romanians | 99.4 /100 | #92 | Exceptional 2.1% |
| Croatians | 99.3 /100 | #93 | Exceptional 2.1% |
| Ukrainians | 99.3 /100 | #94 | Exceptional 2.1% |
| Bermudans | 99.2 /100 | #95 | Exceptional 2.1% |
| Arabs | 99.2 /100 | #96 | Exceptional 2.1% |
| Immigrants | Moldova | 99.1 /100 | #97 | Exceptional 2.1% |
| Guyanese | 99.1 /100 | #98 | Exceptional 2.1% |
| South Africans | 99.1 /100 | #99 | Exceptional 2.1% |
| Immigrants | Northern Africa | 99.0 /100 | #100 | Exceptional 2.1% |
Demographics Similar to Immigrants from Liberia by Single Father Households
In terms of single father households, the demographic groups most similar to Immigrants from Liberia are Dominican (2.5%, a difference of 0.13%), Immigrants from Belize (2.5%, a difference of 0.15%), Immigrants from Caribbean (2.5%, a difference of 0.31%), Comanche (2.5%, a difference of 0.40%), and Spanish (2.5%, a difference of 0.55%).
| Demographics | Rating | Rank | Single Father Households |
| Tongans | 1.5 /100 | #255 | Tragic 2.5% |
| Potawatomi | 1.4 /100 | #256 | Tragic 2.5% |
| Immigrants | Congo | 1.2 /100 | #257 | Tragic 2.5% |
| Spanish | 1.1 /100 | #258 | Tragic 2.5% |
| Comanche | 1.0 /100 | #259 | Tragic 2.5% |
| Immigrants | Caribbean | 1.0 /100 | #260 | Tragic 2.5% |
| Immigrants | Belize | 0.9 /100 | #261 | Tragic 2.5% |
| Immigrants | Liberia | 0.8 /100 | #262 | Tragic 2.5% |
| Dominicans | 0.8 /100 | #263 | Tragic 2.5% |
| Indonesians | 0.5 /100 | #264 | Tragic 2.6% |
| Immigrants | Micronesia | 0.5 /100 | #265 | Tragic 2.6% |
| French American Indians | 0.5 /100 | #266 | Tragic 2.6% |
| Guamanians/Chamorros | 0.4 /100 | #267 | Tragic 2.6% |
| Haitians | 0.4 /100 | #268 | Tragic 2.6% |
| Cubans | 0.3 /100 | #269 | Tragic 2.6% |