Chickasaw vs Turkish Married-couple Households
COMPARE
Chickasaw
Turkish
Married-couple Households
Married-couple Households Comparison
Chickasaw
Turks
45.9%
MARRIED-COUPLE HOUSEHOLDS
22.7/ 100
METRIC RATING
195th/ 347
METRIC RANK
47.8%
MARRIED-COUPLE HOUSEHOLDS
96.1/ 100
METRIC RATING
101st/ 347
METRIC RANK
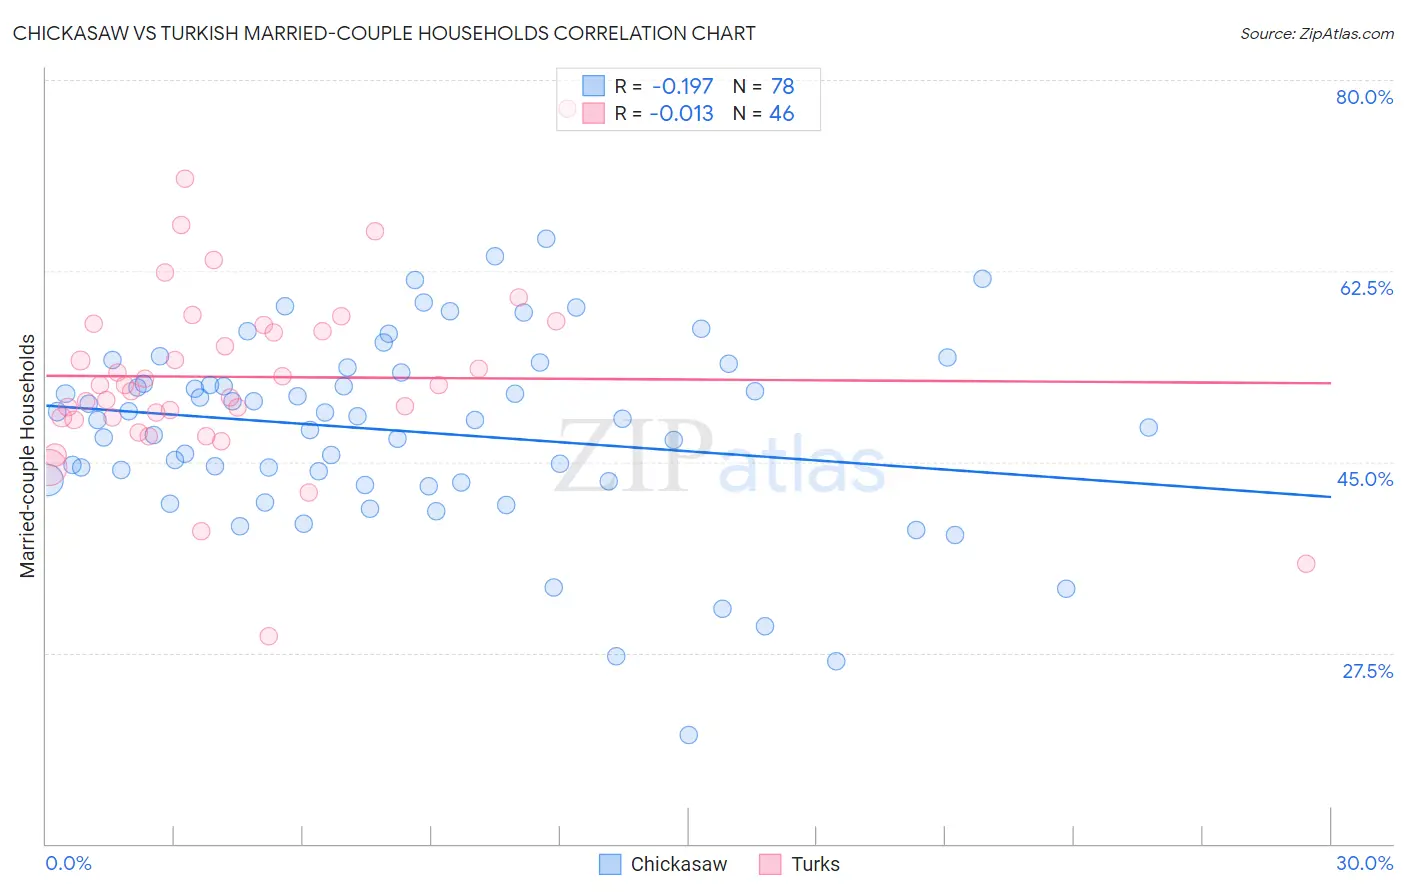
Chickasaw vs Turkish Married-couple Households Correlation Chart
The statistical analysis conducted on geographies consisting of 147,672,630 people shows a poor negative correlation between the proportion of Chickasaw and percentage of married-couple family households in the United States with a correlation coefficient (R) of -0.197 and weighted average of 45.9%. Similarly, the statistical analysis conducted on geographies consisting of 271,700,088 people shows no correlation between the proportion of Turks and percentage of married-couple family households in the United States with a correlation coefficient (R) of -0.013 and weighted average of 47.8%, a difference of 4.2%.
Married-couple Households Correlation Summary
| Measurement | Chickasaw | Turkish |
| Minimum | 20.0% | 29.1% |
| Maximum | 65.4% | 77.4% |
| Range | 45.4% | 48.3% |
| Mean | 47.8% | 52.8% |
| Median | 48.9% | 52.0% |
| Interquartile 25% (IQ1) | 43.2% | 49.0% |
| Interquartile 75% (IQ3) | 53.2% | 57.6% |
| Interquartile Range (IQR) | 10.0% | 8.5% |
| Standard Deviation (Sample) | 8.7% | 8.5% |
| Standard Deviation (Population) | 8.6% | 8.4% |
Similar Demographics by Married-couple Households
Demographics Similar to Chickasaw by Married-couple Households
In terms of married-couple households, the demographic groups most similar to Chickasaw are Mexican American Indian (45.9%, a difference of 0.030%), Immigrants from South America (45.9%, a difference of 0.030%), Taiwanese (45.9%, a difference of 0.040%), Cambodian (45.9%, a difference of 0.080%), and Immigrants from Northern Africa (46.0%, a difference of 0.10%).
| Demographics | Rating | Rank | Married-couple Households |
| South American Indians | 28.4 /100 | #188 | Fair 46.0% |
| Immigrants | Latvia | 26.9 /100 | #189 | Fair 46.0% |
| Immigrants | Kuwait | 25.6 /100 | #190 | Fair 46.0% |
| Choctaw | 24.9 /100 | #191 | Fair 46.0% |
| Immigrants | Northern Africa | 24.6 /100 | #192 | Fair 46.0% |
| Taiwanese | 23.4 /100 | #193 | Fair 45.9% |
| Mexican American Indians | 23.3 /100 | #194 | Fair 45.9% |
| Chickasaw | 22.7 /100 | #195 | Fair 45.9% |
| Immigrants | South America | 22.2 /100 | #196 | Fair 45.9% |
| Cambodians | 21.3 /100 | #197 | Fair 45.9% |
| Ottawa | 19.4 /100 | #198 | Poor 45.8% |
| Carpatho Rusyns | 15.7 /100 | #199 | Poor 45.7% |
| Potawatomi | 15.6 /100 | #200 | Poor 45.7% |
| Immigrants | Serbia | 15.2 /100 | #201 | Poor 45.7% |
| Immigrants | Central America | 14.2 /100 | #202 | Poor 45.7% |
Demographics Similar to Turks by Married-couple Households
In terms of married-couple households, the demographic groups most similar to Turks are Slavic (47.8%, a difference of 0.020%), Hawaiian (47.8%, a difference of 0.020%), Immigrants from South Africa (47.8%, a difference of 0.030%), Immigrants from Italy (47.9%, a difference of 0.060%), and Immigrants from Austria (47.9%, a difference of 0.070%).
| Demographics | Rating | Rank | Married-couple Households |
| Americans | 96.9 /100 | #94 | Exceptional 47.9% |
| Immigrants | Belgium | 96.8 /100 | #95 | Exceptional 47.9% |
| Immigrants | Egypt | 96.6 /100 | #96 | Exceptional 47.9% |
| Latvians | 96.5 /100 | #97 | Exceptional 47.9% |
| Immigrants | North Macedonia | 96.4 /100 | #98 | Exceptional 47.9% |
| Immigrants | Austria | 96.4 /100 | #99 | Exceptional 47.9% |
| Immigrants | Italy | 96.3 /100 | #100 | Exceptional 47.9% |
| Turks | 96.1 /100 | #101 | Exceptional 47.8% |
| Slavs | 96.0 /100 | #102 | Exceptional 47.8% |
| Hawaiians | 96.0 /100 | #103 | Exceptional 47.8% |
| Immigrants | South Africa | 96.0 /100 | #104 | Exceptional 47.8% |
| Immigrants | Czechoslovakia | 95.5 /100 | #105 | Exceptional 47.8% |
| Portuguese | 95.5 /100 | #106 | Exceptional 47.8% |
| Estonians | 94.7 /100 | #107 | Exceptional 47.7% |
| Immigrants | Japan | 94.4 /100 | #108 | Exceptional 47.7% |