Immigrants from Africa vs Turkish Married-couple Households
COMPARE
Immigrants from Africa
Turkish
Married-couple Households
Married-couple Households Comparison
Immigrants from Africa
Turks
42.9%
MARRIED-COUPLE HOUSEHOLDS
0.0/ 100
METRIC RATING
278th/ 347
METRIC RANK
47.8%
MARRIED-COUPLE HOUSEHOLDS
96.1/ 100
METRIC RATING
101st/ 347
METRIC RANK
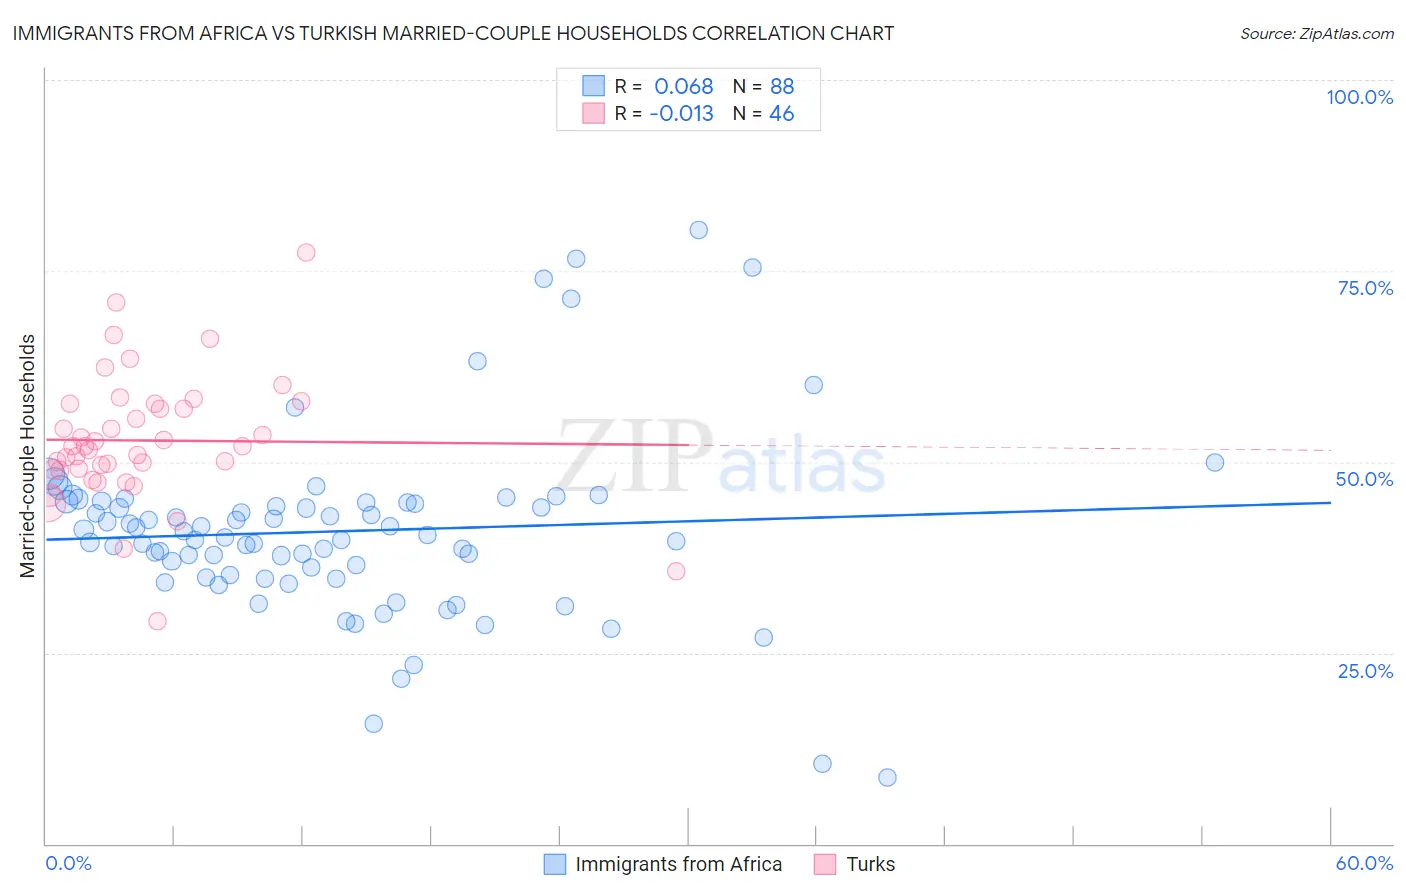
Immigrants from Africa vs Turkish Married-couple Households Correlation Chart
The statistical analysis conducted on geographies consisting of 468,925,641 people shows a slight positive correlation between the proportion of Immigrants from Africa and percentage of married-couple family households in the United States with a correlation coefficient (R) of 0.068 and weighted average of 42.9%. Similarly, the statistical analysis conducted on geographies consisting of 271,700,088 people shows no correlation between the proportion of Turks and percentage of married-couple family households in the United States with a correlation coefficient (R) of -0.013 and weighted average of 47.8%, a difference of 11.5%.
Married-couple Households Correlation Summary
| Measurement | Immigrants from Africa | Turkish |
| Minimum | 8.7% | 29.1% |
| Maximum | 80.4% | 77.4% |
| Range | 71.7% | 48.3% |
| Mean | 40.9% | 52.8% |
| Median | 40.3% | 52.0% |
| Interquartile 25% (IQ1) | 35.0% | 49.0% |
| Interquartile 75% (IQ3) | 44.7% | 57.6% |
| Interquartile Range (IQR) | 9.7% | 8.5% |
| Standard Deviation (Sample) | 12.1% | 8.5% |
| Standard Deviation (Population) | 12.1% | 8.4% |
Similar Demographics by Married-couple Households
Demographics Similar to Immigrants from Africa by Married-couple Households
In terms of married-couple households, the demographic groups most similar to Immigrants from Africa are Sierra Leonean (42.9%, a difference of 0.030%), Immigrants from Ecuador (42.9%, a difference of 0.080%), Immigrants from Eastern Africa (42.9%, a difference of 0.11%), Immigrants from Guatemala (42.8%, a difference of 0.16%), and Immigrants from Ethiopia (43.1%, a difference of 0.36%).
| Demographics | Rating | Rank | Married-couple Households |
| Guatemalans | 0.1 /100 | #271 | Tragic 43.3% |
| Immigrants | Nigeria | 0.1 /100 | #272 | Tragic 43.2% |
| Ethiopians | 0.1 /100 | #273 | Tragic 43.2% |
| Nigerians | 0.1 /100 | #274 | Tragic 43.2% |
| Immigrants | Bangladesh | 0.0 /100 | #275 | Tragic 43.1% |
| Immigrants | Ethiopia | 0.0 /100 | #276 | Tragic 43.1% |
| Immigrants | Eastern Africa | 0.0 /100 | #277 | Tragic 42.9% |
| Immigrants | Africa | 0.0 /100 | #278 | Tragic 42.9% |
| Sierra Leoneans | 0.0 /100 | #279 | Tragic 42.9% |
| Immigrants | Ecuador | 0.0 /100 | #280 | Tragic 42.9% |
| Immigrants | Guatemala | 0.0 /100 | #281 | Tragic 42.8% |
| Bermudans | 0.0 /100 | #282 | Tragic 42.4% |
| Inupiat | 0.0 /100 | #283 | Tragic 42.4% |
| Cheyenne | 0.0 /100 | #284 | Tragic 42.3% |
| Ghanaians | 0.0 /100 | #285 | Tragic 42.2% |
Demographics Similar to Turks by Married-couple Households
In terms of married-couple households, the demographic groups most similar to Turks are Slavic (47.8%, a difference of 0.020%), Hawaiian (47.8%, a difference of 0.020%), Immigrants from South Africa (47.8%, a difference of 0.030%), Immigrants from Italy (47.9%, a difference of 0.060%), and Immigrants from Austria (47.9%, a difference of 0.070%).
| Demographics | Rating | Rank | Married-couple Households |
| Americans | 96.9 /100 | #94 | Exceptional 47.9% |
| Immigrants | Belgium | 96.8 /100 | #95 | Exceptional 47.9% |
| Immigrants | Egypt | 96.6 /100 | #96 | Exceptional 47.9% |
| Latvians | 96.5 /100 | #97 | Exceptional 47.9% |
| Immigrants | North Macedonia | 96.4 /100 | #98 | Exceptional 47.9% |
| Immigrants | Austria | 96.4 /100 | #99 | Exceptional 47.9% |
| Immigrants | Italy | 96.3 /100 | #100 | Exceptional 47.9% |
| Turks | 96.1 /100 | #101 | Exceptional 47.8% |
| Slavs | 96.0 /100 | #102 | Exceptional 47.8% |
| Hawaiians | 96.0 /100 | #103 | Exceptional 47.8% |
| Immigrants | South Africa | 96.0 /100 | #104 | Exceptional 47.8% |
| Immigrants | Czechoslovakia | 95.5 /100 | #105 | Exceptional 47.8% |
| Portuguese | 95.5 /100 | #106 | Exceptional 47.8% |
| Estonians | 94.7 /100 | #107 | Exceptional 47.7% |
| Immigrants | Japan | 94.4 /100 | #108 | Exceptional 47.7% |