European vs Turkish Married-couple Households
COMPARE
European
Turkish
Married-couple Households
Married-couple Households Comparison
Europeans
Turks
49.6%
MARRIED-COUPLE HOUSEHOLDS
99.9/ 100
METRIC RATING
19th/ 347
METRIC RANK
47.8%
MARRIED-COUPLE HOUSEHOLDS
96.1/ 100
METRIC RATING
101st/ 347
METRIC RANK
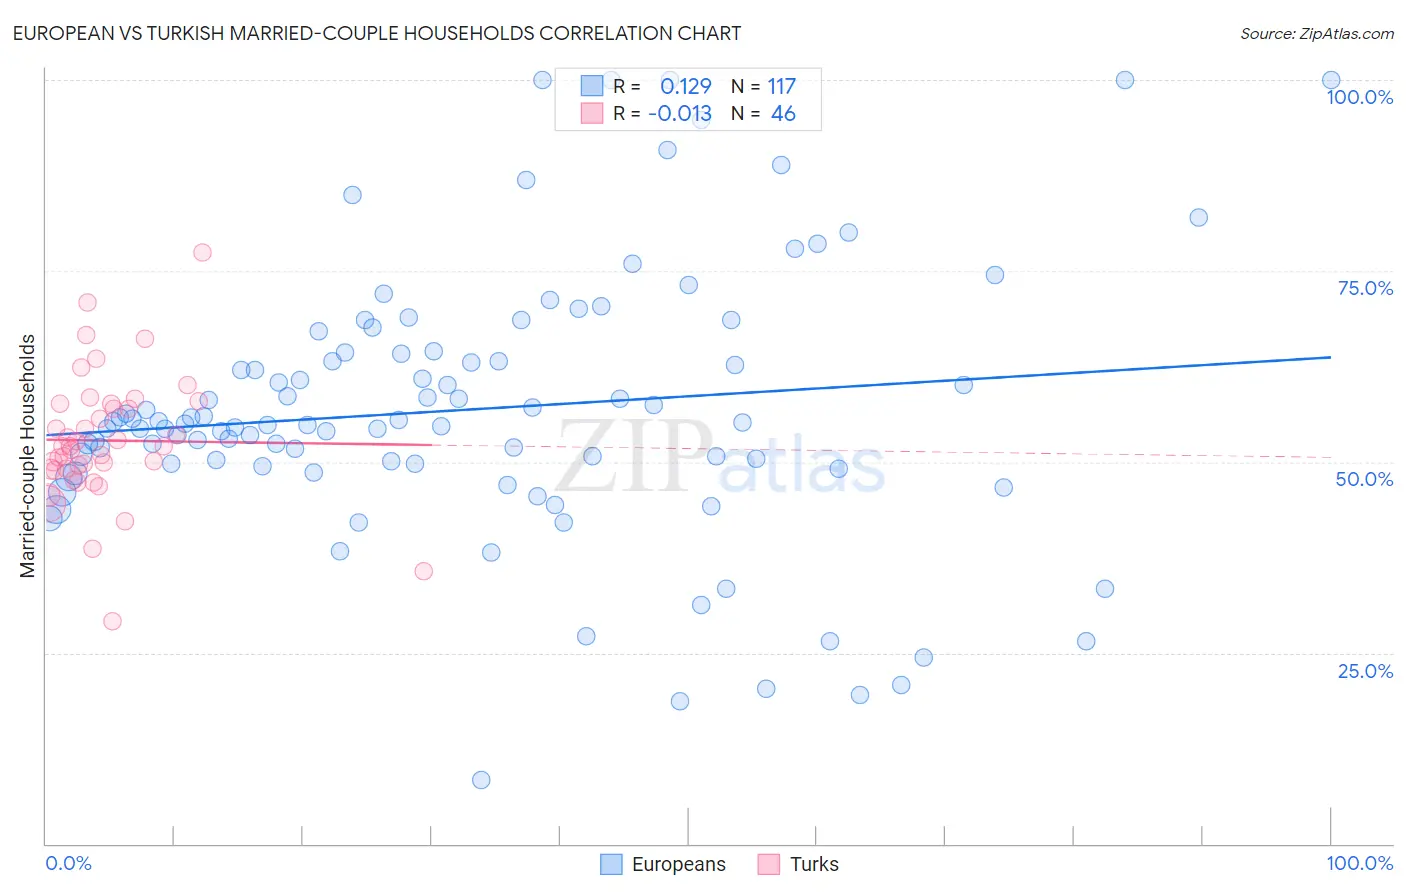
European vs Turkish Married-couple Households Correlation Chart
The statistical analysis conducted on geographies consisting of 561,207,916 people shows a poor positive correlation between the proportion of Europeans and percentage of married-couple family households in the United States with a correlation coefficient (R) of 0.129 and weighted average of 49.6%. Similarly, the statistical analysis conducted on geographies consisting of 271,700,088 people shows no correlation between the proportion of Turks and percentage of married-couple family households in the United States with a correlation coefficient (R) of -0.013 and weighted average of 47.8%, a difference of 3.6%.
Married-couple Households Correlation Summary
| Measurement | European | Turkish |
| Minimum | 8.3% | 29.1% |
| Maximum | 100.0% | 77.4% |
| Range | 91.7% | 48.3% |
| Mean | 56.8% | 52.8% |
| Median | 54.9% | 52.0% |
| Interquartile 25% (IQ1) | 49.6% | 49.0% |
| Interquartile 75% (IQ3) | 64.2% | 57.6% |
| Interquartile Range (IQR) | 14.6% | 8.5% |
| Standard Deviation (Sample) | 17.7% | 8.5% |
| Standard Deviation (Population) | 17.6% | 8.4% |
Similar Demographics by Married-couple Households
Demographics Similar to Europeans by Married-couple Households
In terms of married-couple households, the demographic groups most similar to Europeans are Scandinavian (49.6%, a difference of 0.0%), Norwegian (49.5%, a difference of 0.060%), English (49.6%, a difference of 0.16%), Immigrants from Hong Kong (49.6%, a difference of 0.17%), and Asian (49.5%, a difference of 0.17%).
| Demographics | Rating | Rank | Married-couple Households |
| Swiss | 100.0 /100 | #12 | Exceptional 49.9% |
| Immigrants | Korea | 100.0 /100 | #13 | Exceptional 49.9% |
| Burmese | 100.0 /100 | #14 | Exceptional 49.8% |
| Koreans | 99.9 /100 | #15 | Exceptional 49.7% |
| Swedes | 99.9 /100 | #16 | Exceptional 49.7% |
| Immigrants | Hong Kong | 99.9 /100 | #17 | Exceptional 49.6% |
| English | 99.9 /100 | #18 | Exceptional 49.6% |
| Europeans | 99.9 /100 | #19 | Exceptional 49.6% |
| Scandinavians | 99.9 /100 | #20 | Exceptional 49.6% |
| Norwegians | 99.9 /100 | #21 | Exceptional 49.5% |
| Asians | 99.9 /100 | #22 | Exceptional 49.5% |
| Dutch | 99.9 /100 | #23 | Exceptional 49.5% |
| Czechs | 99.9 /100 | #24 | Exceptional 49.4% |
| Immigrants | Philippines | 99.9 /100 | #25 | Exceptional 49.3% |
| Immigrants | Scotland | 99.8 /100 | #26 | Exceptional 49.3% |
Demographics Similar to Turks by Married-couple Households
In terms of married-couple households, the demographic groups most similar to Turks are Slavic (47.8%, a difference of 0.020%), Hawaiian (47.8%, a difference of 0.020%), Immigrants from South Africa (47.8%, a difference of 0.030%), Immigrants from Italy (47.9%, a difference of 0.060%), and Immigrants from Austria (47.9%, a difference of 0.070%).
| Demographics | Rating | Rank | Married-couple Households |
| Americans | 96.9 /100 | #94 | Exceptional 47.9% |
| Immigrants | Belgium | 96.8 /100 | #95 | Exceptional 47.9% |
| Immigrants | Egypt | 96.6 /100 | #96 | Exceptional 47.9% |
| Latvians | 96.5 /100 | #97 | Exceptional 47.9% |
| Immigrants | North Macedonia | 96.4 /100 | #98 | Exceptional 47.9% |
| Immigrants | Austria | 96.4 /100 | #99 | Exceptional 47.9% |
| Immigrants | Italy | 96.3 /100 | #100 | Exceptional 47.9% |
| Turks | 96.1 /100 | #101 | Exceptional 47.8% |
| Slavs | 96.0 /100 | #102 | Exceptional 47.8% |
| Hawaiians | 96.0 /100 | #103 | Exceptional 47.8% |
| Immigrants | South Africa | 96.0 /100 | #104 | Exceptional 47.8% |
| Immigrants | Czechoslovakia | 95.5 /100 | #105 | Exceptional 47.8% |
| Portuguese | 95.5 /100 | #106 | Exceptional 47.8% |
| Estonians | 94.7 /100 | #107 | Exceptional 47.7% |
| Immigrants | Japan | 94.4 /100 | #108 | Exceptional 47.7% |