Ghanaian vs Immigrants from South America Currently Married
COMPARE
Ghanaian
Immigrants from South America
Currently Married
Currently Married Comparison
Ghanaians
Immigrants from South America
42.9%
CURRENTLY MARRIED
0.0/ 100
METRIC RATING
286th/ 347
METRIC RANK
45.7%
CURRENTLY MARRIED
10.8/ 100
METRIC RATING
207th/ 347
METRIC RANK
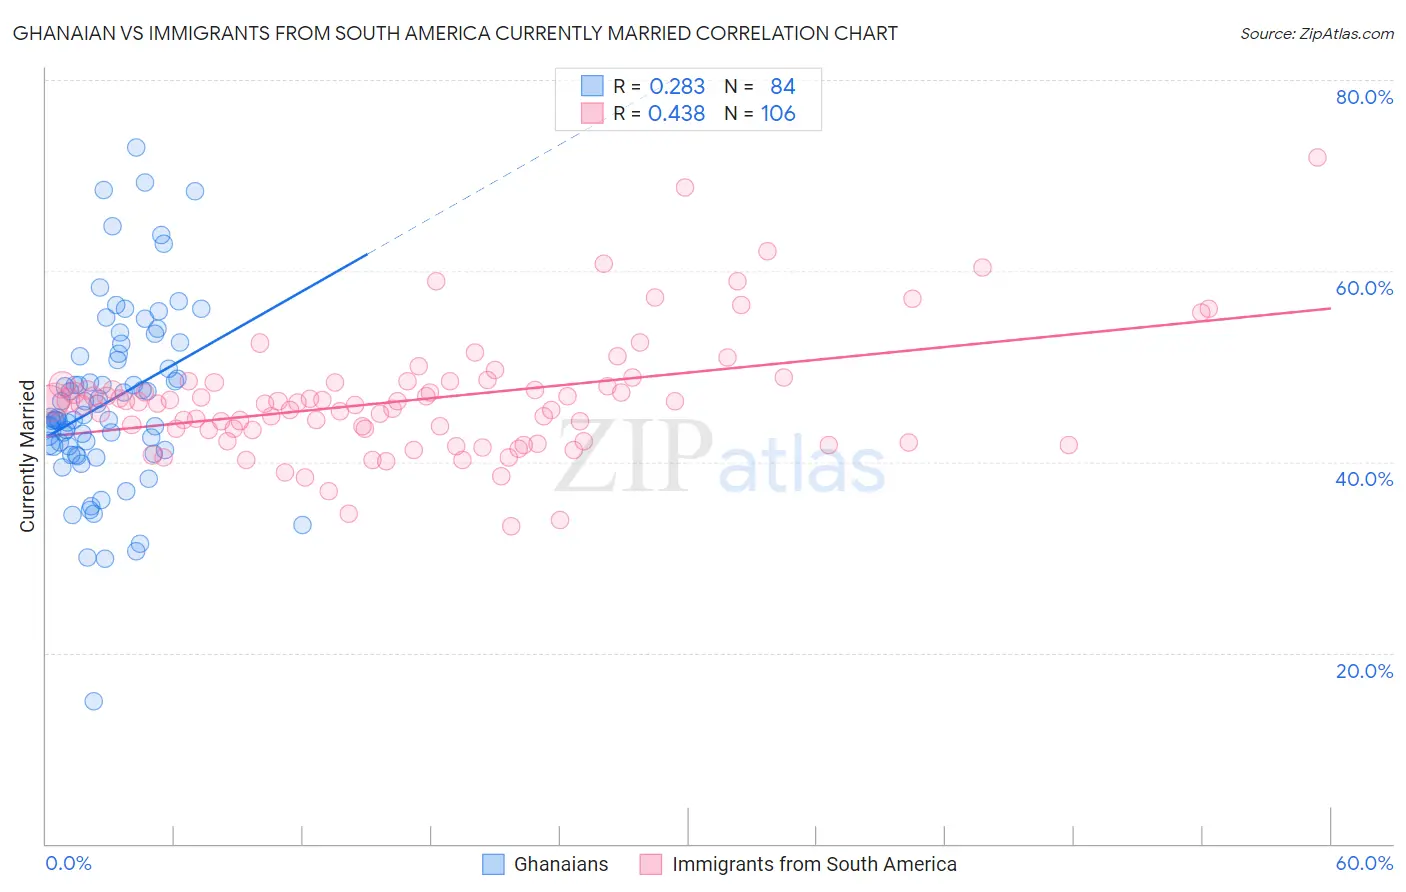
Ghanaian vs Immigrants from South America Currently Married Correlation Chart
The statistical analysis conducted on geographies consisting of 190,682,082 people shows a weak positive correlation between the proportion of Ghanaians and percentage of population currently married in the United States with a correlation coefficient (R) of 0.283 and weighted average of 42.9%. Similarly, the statistical analysis conducted on geographies consisting of 486,361,884 people shows a moderate positive correlation between the proportion of Immigrants from South America and percentage of population currently married in the United States with a correlation coefficient (R) of 0.438 and weighted average of 45.7%, a difference of 6.6%.
Currently Married Correlation Summary
| Measurement | Ghanaian | Immigrants from South America |
| Minimum | 14.9% | 33.3% |
| Maximum | 72.9% | 71.9% |
| Range | 58.0% | 38.6% |
| Mean | 46.3% | 46.5% |
| Median | 44.6% | 46.2% |
| Interquartile 25% (IQ1) | 41.5% | 43.3% |
| Interquartile 75% (IQ3) | 51.2% | 48.3% |
| Interquartile Range (IQR) | 9.8% | 4.9% |
| Standard Deviation (Sample) | 9.6% | 6.3% |
| Standard Deviation (Population) | 9.6% | 6.3% |
Similar Demographics by Currently Married
Demographics Similar to Ghanaians by Currently Married
In terms of currently married, the demographic groups most similar to Ghanaians are Guatemalan (42.9%, a difference of 0.020%), Immigrants from Middle Africa (43.0%, a difference of 0.13%), Native/Alaskan (42.8%, a difference of 0.29%), Paiute (42.7%, a difference of 0.52%), and Immigrants from El Salvador (43.1%, a difference of 0.53%).
| Demographics | Rating | Rank | Currently Married |
| Central American Indians | 0.0 /100 | #279 | Tragic 43.3% |
| Apache | 0.0 /100 | #280 | Tragic 43.2% |
| Chippewa | 0.0 /100 | #281 | Tragic 43.2% |
| Immigrants | Ecuador | 0.0 /100 | #282 | Tragic 43.2% |
| Kiowa | 0.0 /100 | #283 | Tragic 43.2% |
| Immigrants | El Salvador | 0.0 /100 | #284 | Tragic 43.1% |
| Immigrants | Middle Africa | 0.0 /100 | #285 | Tragic 43.0% |
| Ghanaians | 0.0 /100 | #286 | Tragic 42.9% |
| Guatemalans | 0.0 /100 | #287 | Tragic 42.9% |
| Natives/Alaskans | 0.0 /100 | #288 | Tragic 42.8% |
| Paiute | 0.0 /100 | #289 | Tragic 42.7% |
| Immigrants | Ghana | 0.0 /100 | #290 | Tragic 42.7% |
| Immigrants | Guatemala | 0.0 /100 | #291 | Tragic 42.6% |
| Sub-Saharan Africans | 0.0 /100 | #292 | Tragic 42.6% |
| Yuman | 0.0 /100 | #293 | Tragic 42.6% |
Demographics Similar to Immigrants from South America by Currently Married
In terms of currently married, the demographic groups most similar to Immigrants from South America are Alsatian (45.7%, a difference of 0.010%), Immigrants (45.8%, a difference of 0.040%), South American Indian (45.8%, a difference of 0.060%), Taiwanese (45.8%, a difference of 0.080%), and Immigrants from Spain (45.8%, a difference of 0.080%).
| Demographics | Rating | Rank | Currently Married |
| Creek | 17.2 /100 | #200 | Poor 46.0% |
| Malaysians | 15.3 /100 | #201 | Poor 45.9% |
| Immigrants | Albania | 14.5 /100 | #202 | Poor 45.9% |
| Taiwanese | 11.7 /100 | #203 | Poor 45.8% |
| Immigrants | Spain | 11.6 /100 | #204 | Poor 45.8% |
| South American Indians | 11.5 /100 | #205 | Poor 45.8% |
| Immigrants | Immigrants | 11.2 /100 | #206 | Poor 45.8% |
| Immigrants | South America | 10.8 /100 | #207 | Poor 45.7% |
| Alsatians | 10.8 /100 | #208 | Poor 45.7% |
| Immigrants | Micronesia | 8.8 /100 | #209 | Tragic 45.6% |
| Uruguayans | 7.9 /100 | #210 | Tragic 45.6% |
| Houma | 7.2 /100 | #211 | Tragic 45.5% |
| Marshallese | 7.2 /100 | #212 | Tragic 45.5% |
| Alaska Natives | 7.0 /100 | #213 | Tragic 45.5% |
| Dutch West Indians | 6.7 /100 | #214 | Tragic 45.5% |