Celtic vs Japanese Currently Married
COMPARE
Celtic
Japanese
Currently Married
Currently Married Comparison
Celtics
Japanese
47.8%
CURRENTLY MARRIED
94.2/ 100
METRIC RATING
100th/ 347
METRIC RANK
44.5%
CURRENTLY MARRIED
0.6/ 100
METRIC RATING
244th/ 347
METRIC RANK
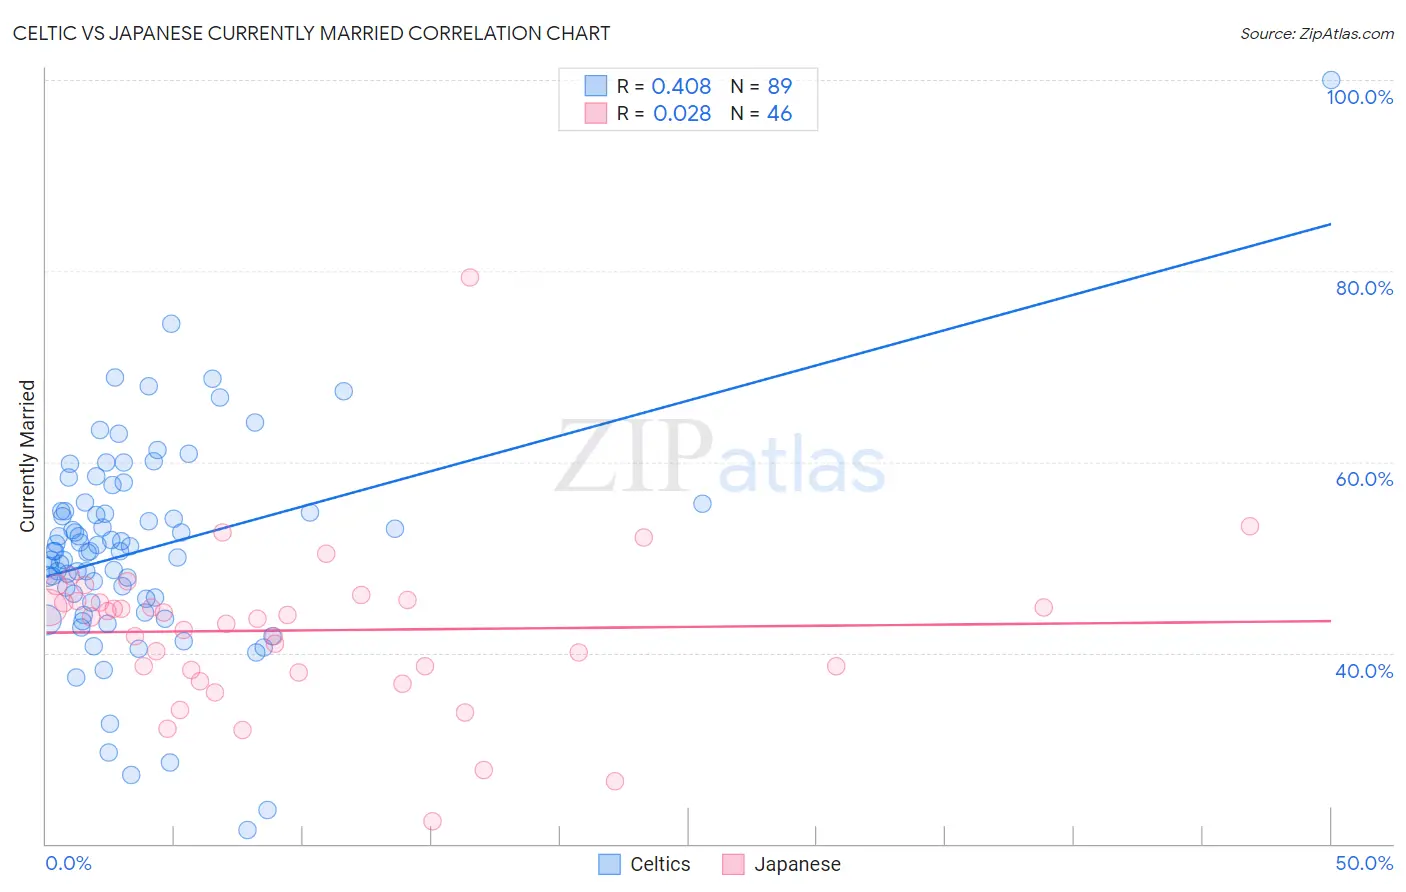
Celtic vs Japanese Currently Married Correlation Chart
The statistical analysis conducted on geographies consisting of 168,877,326 people shows a moderate positive correlation between the proportion of Celtics and percentage of population currently married in the United States with a correlation coefficient (R) of 0.408 and weighted average of 47.8%. Similarly, the statistical analysis conducted on geographies consisting of 249,168,550 people shows no correlation between the proportion of Japanese and percentage of population currently married in the United States with a correlation coefficient (R) of 0.028 and weighted average of 44.5%, a difference of 7.5%.
Currently Married Correlation Summary
| Measurement | Celtic | Japanese |
| Minimum | 21.4% | 22.4% |
| Maximum | 100.0% | 79.3% |
| Range | 78.6% | 56.9% |
| Mean | 50.8% | 42.3% |
| Median | 50.7% | 43.7% |
| Interquartile 25% (IQ1) | 45.4% | 38.2% |
| Interquartile 75% (IQ3) | 55.2% | 45.4% |
| Interquartile Range (IQR) | 9.8% | 7.2% |
| Standard Deviation (Sample) | 11.1% | 8.6% |
| Standard Deviation (Population) | 11.0% | 8.6% |
Similar Demographics by Currently Married
Demographics Similar to Celtics by Currently Married
In terms of currently married, the demographic groups most similar to Celtics are Immigrants from Sweden (47.8%, a difference of 0.020%), Immigrants from Germany (47.8%, a difference of 0.020%), Turkish (47.8%, a difference of 0.040%), Cypriot (47.8%, a difference of 0.070%), and Serbian (47.8%, a difference of 0.080%).
| Demographics | Rating | Rank | Currently Married |
| Lebanese | 95.1 /100 | #93 | Exceptional 47.9% |
| Native Hawaiians | 95.0 /100 | #94 | Exceptional 47.9% |
| Immigrants | Bulgaria | 94.8 /100 | #95 | Exceptional 47.9% |
| Egyptians | 94.8 /100 | #96 | Exceptional 47.9% |
| Immigrants | Ukraine | 94.8 /100 | #97 | Exceptional 47.9% |
| Immigrants | China | 94.7 /100 | #98 | Exceptional 47.9% |
| Immigrants | Sweden | 94.3 /100 | #99 | Exceptional 47.8% |
| Celtics | 94.2 /100 | #100 | Exceptional 47.8% |
| Immigrants | Germany | 94.1 /100 | #101 | Exceptional 47.8% |
| Turks | 93.9 /100 | #102 | Exceptional 47.8% |
| Cypriots | 93.7 /100 | #103 | Exceptional 47.8% |
| Serbians | 93.6 /100 | #104 | Exceptional 47.8% |
| Immigrants | Singapore | 93.3 /100 | #105 | Exceptional 47.8% |
| Immigrants | Greece | 93.1 /100 | #106 | Exceptional 47.7% |
| Immigrants | Italy | 92.9 /100 | #107 | Exceptional 47.7% |
Demographics Similar to Japanese by Currently Married
In terms of currently married, the demographic groups most similar to Japanese are Immigrants from Ethiopia (44.5%, a difference of 0.070%), Immigrants from Cambodia (44.5%, a difference of 0.090%), Ethiopian (44.5%, a difference of 0.12%), Immigrants from Mexico (44.5%, a difference of 0.18%), and Mexican American Indian (44.5%, a difference of 0.18%).
| Demographics | Rating | Rank | Currently Married |
| Seminole | 0.9 /100 | #237 | Tragic 44.6% |
| Moroccans | 0.9 /100 | #238 | Tragic 44.6% |
| Immigrants | Mexico | 0.7 /100 | #239 | Tragic 44.5% |
| Mexican American Indians | 0.7 /100 | #240 | Tragic 44.5% |
| Ethiopians | 0.7 /100 | #241 | Tragic 44.5% |
| Immigrants | Cambodia | 0.7 /100 | #242 | Tragic 44.5% |
| Immigrants | Ethiopia | 0.7 /100 | #243 | Tragic 44.5% |
| Japanese | 0.6 /100 | #244 | Tragic 44.5% |
| Immigrants | Armenia | 0.4 /100 | #245 | Tragic 44.3% |
| Immigrants | Burma/Myanmar | 0.4 /100 | #246 | Tragic 44.3% |
| Ugandans | 0.4 /100 | #247 | Tragic 44.2% |
| Nicaraguans | 0.3 /100 | #248 | Tragic 44.2% |
| Immigrants | Cameroon | 0.3 /100 | #249 | Tragic 44.2% |
| Immigrants | Eastern Africa | 0.3 /100 | #250 | Tragic 44.2% |
| Blackfeet | 0.3 /100 | #251 | Tragic 44.2% |