Celtic vs Cheyenne Currently Married
COMPARE
Celtic
Cheyenne
Currently Married
Currently Married Comparison
Celtics
Cheyenne
47.8%
CURRENTLY MARRIED
94.2/ 100
METRIC RATING
100th/ 347
METRIC RANK
42.2%
CURRENTLY MARRIED
0.0/ 100
METRIC RATING
297th/ 347
METRIC RANK
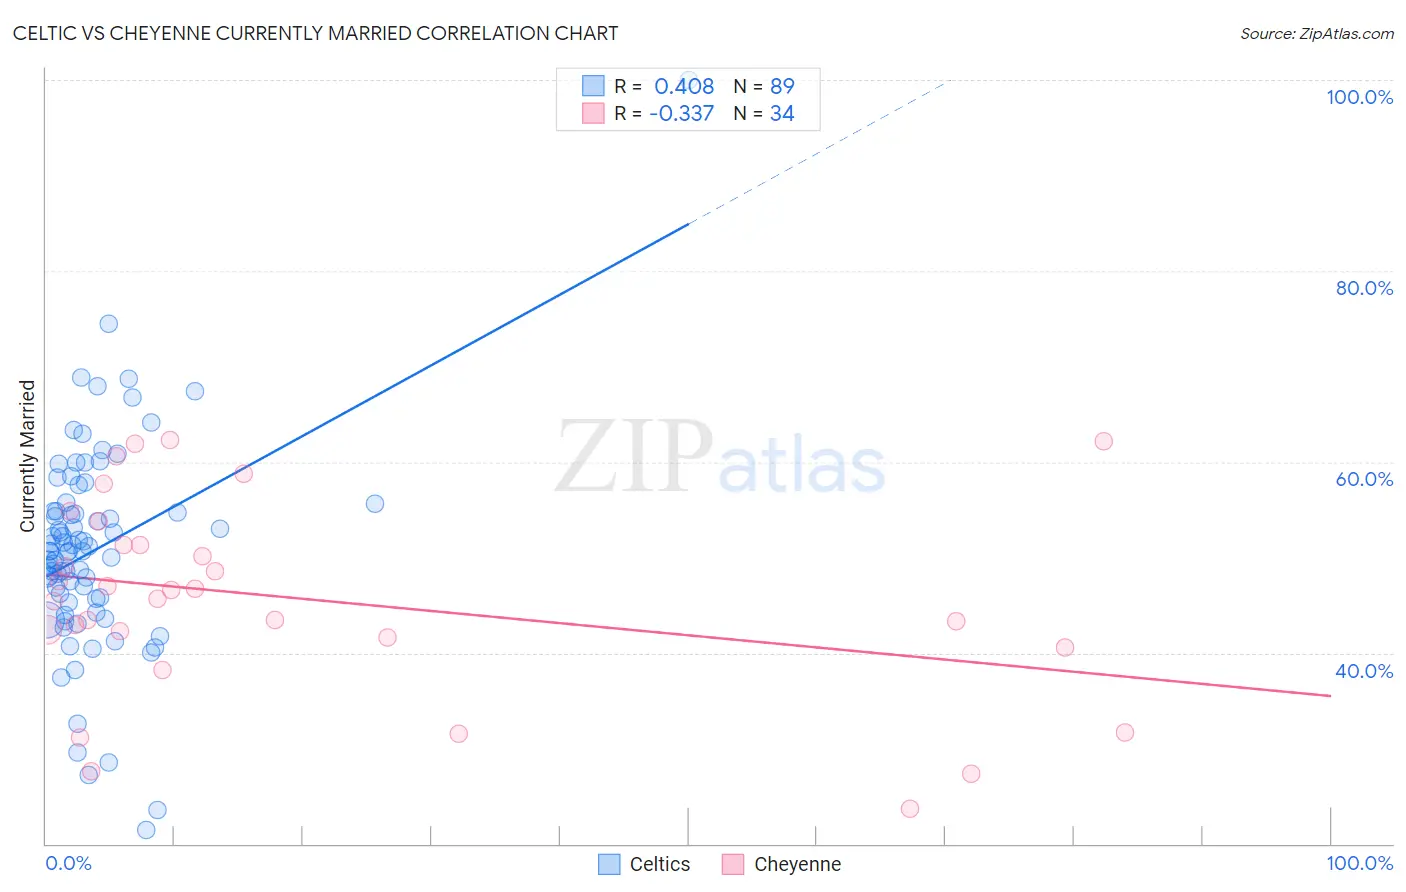
Celtic vs Cheyenne Currently Married Correlation Chart
The statistical analysis conducted on geographies consisting of 168,877,326 people shows a moderate positive correlation between the proportion of Celtics and percentage of population currently married in the United States with a correlation coefficient (R) of 0.408 and weighted average of 47.8%. Similarly, the statistical analysis conducted on geographies consisting of 80,721,070 people shows a mild negative correlation between the proportion of Cheyenne and percentage of population currently married in the United States with a correlation coefficient (R) of -0.337 and weighted average of 42.2%, a difference of 13.2%.
Currently Married Correlation Summary
| Measurement | Celtic | Cheyenne |
| Minimum | 21.4% | 23.7% |
| Maximum | 100.0% | 62.3% |
| Range | 78.6% | 38.6% |
| Mean | 50.8% | 45.6% |
| Median | 50.7% | 46.1% |
| Interquartile 25% (IQ1) | 45.4% | 41.6% |
| Interquartile 75% (IQ3) | 55.2% | 51.4% |
| Interquartile Range (IQR) | 9.8% | 9.8% |
| Standard Deviation (Sample) | 11.1% | 10.3% |
| Standard Deviation (Population) | 11.0% | 10.2% |
Similar Demographics by Currently Married
Demographics Similar to Celtics by Currently Married
In terms of currently married, the demographic groups most similar to Celtics are Immigrants from Sweden (47.8%, a difference of 0.020%), Immigrants from Germany (47.8%, a difference of 0.020%), Turkish (47.8%, a difference of 0.040%), Cypriot (47.8%, a difference of 0.070%), and Serbian (47.8%, a difference of 0.080%).
| Demographics | Rating | Rank | Currently Married |
| Lebanese | 95.1 /100 | #93 | Exceptional 47.9% |
| Native Hawaiians | 95.0 /100 | #94 | Exceptional 47.9% |
| Immigrants | Bulgaria | 94.8 /100 | #95 | Exceptional 47.9% |
| Egyptians | 94.8 /100 | #96 | Exceptional 47.9% |
| Immigrants | Ukraine | 94.8 /100 | #97 | Exceptional 47.9% |
| Immigrants | China | 94.7 /100 | #98 | Exceptional 47.9% |
| Immigrants | Sweden | 94.3 /100 | #99 | Exceptional 47.8% |
| Celtics | 94.2 /100 | #100 | Exceptional 47.8% |
| Immigrants | Germany | 94.1 /100 | #101 | Exceptional 47.8% |
| Turks | 93.9 /100 | #102 | Exceptional 47.8% |
| Cypriots | 93.7 /100 | #103 | Exceptional 47.8% |
| Serbians | 93.6 /100 | #104 | Exceptional 47.8% |
| Immigrants | Singapore | 93.3 /100 | #105 | Exceptional 47.8% |
| Immigrants | Greece | 93.1 /100 | #106 | Exceptional 47.7% |
| Immigrants | Italy | 92.9 /100 | #107 | Exceptional 47.7% |
Demographics Similar to Cheyenne by Currently Married
In terms of currently married, the demographic groups most similar to Cheyenne are Immigrants from Honduras (42.2%, a difference of 0.090%), Menominee (42.3%, a difference of 0.11%), Liberian (42.2%, a difference of 0.12%), Belizean (42.2%, a difference of 0.22%), and Immigrants from Western Africa (42.4%, a difference of 0.31%).
| Demographics | Rating | Rank | Currently Married |
| Immigrants | Ghana | 0.0 /100 | #290 | Tragic 42.7% |
| Immigrants | Guatemala | 0.0 /100 | #291 | Tragic 42.6% |
| Sub-Saharan Africans | 0.0 /100 | #292 | Tragic 42.6% |
| Yuman | 0.0 /100 | #293 | Tragic 42.6% |
| Hondurans | 0.0 /100 | #294 | Tragic 42.5% |
| Immigrants | Western Africa | 0.0 /100 | #295 | Tragic 42.4% |
| Menominee | 0.0 /100 | #296 | Tragic 42.3% |
| Cheyenne | 0.0 /100 | #297 | Tragic 42.2% |
| Immigrants | Honduras | 0.0 /100 | #298 | Tragic 42.2% |
| Liberians | 0.0 /100 | #299 | Tragic 42.2% |
| Belizeans | 0.0 /100 | #300 | Tragic 42.2% |
| Immigrants | Yemen | 0.0 /100 | #301 | Tragic 42.1% |
| Immigrants | Zaire | 0.0 /100 | #302 | Tragic 42.0% |
| Sioux | 0.0 /100 | #303 | Tragic 41.9% |
| Immigrants | Bahamas | 0.0 /100 | #304 | Tragic 41.9% |