Celtic vs Immigrants from Northern Africa Currently Married
COMPARE
Celtic
Immigrants from Northern Africa
Currently Married
Currently Married Comparison
Celtics
Immigrants from Northern Africa
47.8%
CURRENTLY MARRIED
94.2/ 100
METRIC RATING
100th/ 347
METRIC RANK
46.5%
CURRENTLY MARRIED
39.7/ 100
METRIC RATING
183rd/ 347
METRIC RANK
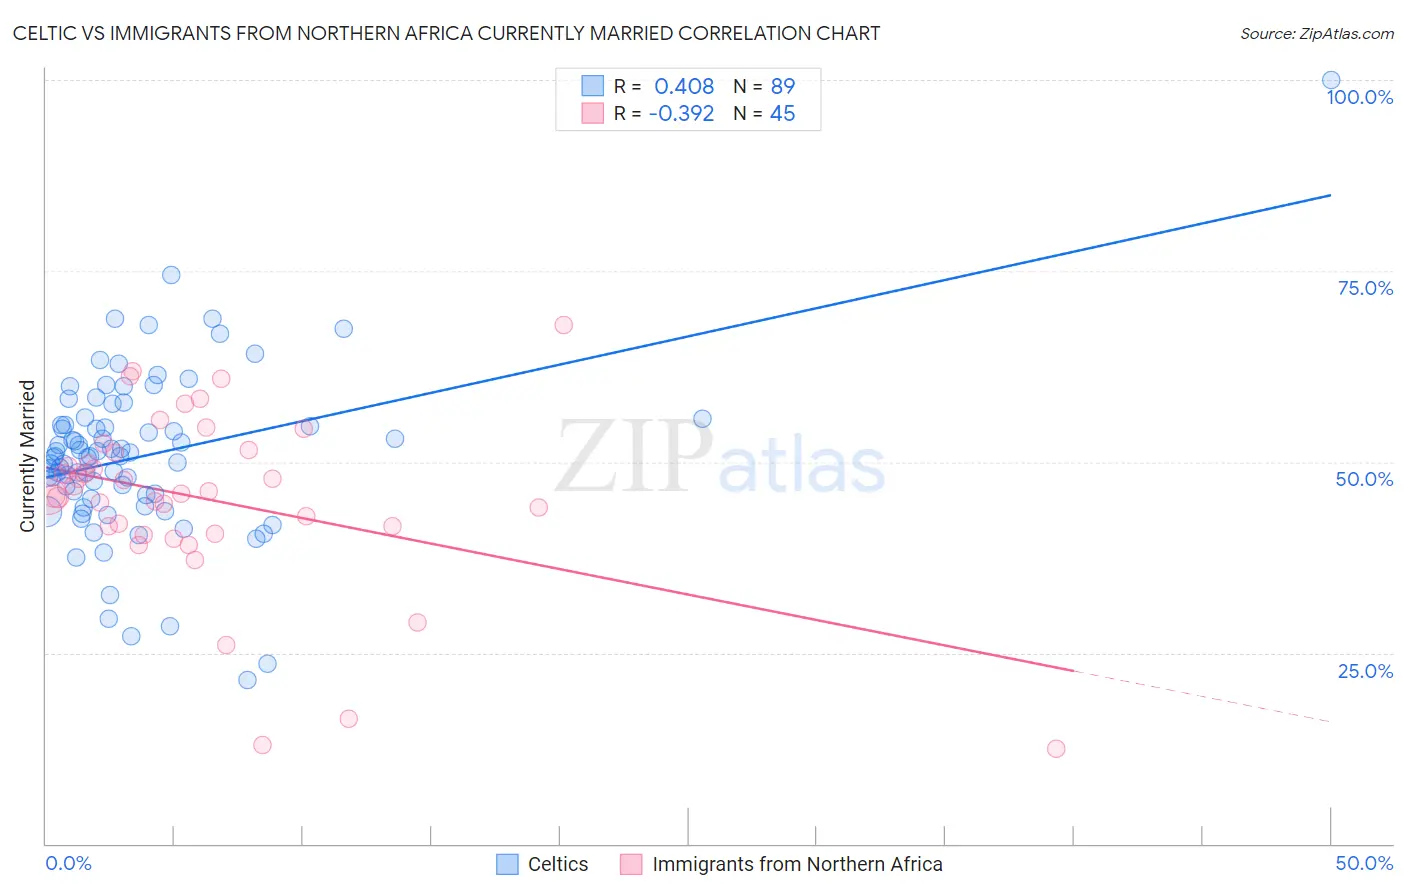
Celtic vs Immigrants from Northern Africa Currently Married Correlation Chart
The statistical analysis conducted on geographies consisting of 168,877,326 people shows a moderate positive correlation between the proportion of Celtics and percentage of population currently married in the United States with a correlation coefficient (R) of 0.408 and weighted average of 47.8%. Similarly, the statistical analysis conducted on geographies consisting of 321,174,675 people shows a mild negative correlation between the proportion of Immigrants from Northern Africa and percentage of population currently married in the United States with a correlation coefficient (R) of -0.392 and weighted average of 46.5%, a difference of 2.9%.
Currently Married Correlation Summary
| Measurement | Celtic | Immigrants from Northern Africa |
| Minimum | 21.4% | 12.5% |
| Maximum | 100.0% | 67.9% |
| Range | 78.6% | 55.4% |
| Mean | 50.8% | 45.1% |
| Median | 50.7% | 45.9% |
| Interquartile 25% (IQ1) | 45.4% | 41.1% |
| Interquartile 75% (IQ3) | 55.2% | 51.4% |
| Interquartile Range (IQR) | 9.8% | 10.3% |
| Standard Deviation (Sample) | 11.1% | 11.6% |
| Standard Deviation (Population) | 11.0% | 11.5% |
Similar Demographics by Currently Married
Demographics Similar to Celtics by Currently Married
In terms of currently married, the demographic groups most similar to Celtics are Immigrants from Sweden (47.8%, a difference of 0.020%), Immigrants from Germany (47.8%, a difference of 0.020%), Turkish (47.8%, a difference of 0.040%), Cypriot (47.8%, a difference of 0.070%), and Serbian (47.8%, a difference of 0.080%).
| Demographics | Rating | Rank | Currently Married |
| Lebanese | 95.1 /100 | #93 | Exceptional 47.9% |
| Native Hawaiians | 95.0 /100 | #94 | Exceptional 47.9% |
| Immigrants | Bulgaria | 94.8 /100 | #95 | Exceptional 47.9% |
| Egyptians | 94.8 /100 | #96 | Exceptional 47.9% |
| Immigrants | Ukraine | 94.8 /100 | #97 | Exceptional 47.9% |
| Immigrants | China | 94.7 /100 | #98 | Exceptional 47.9% |
| Immigrants | Sweden | 94.3 /100 | #99 | Exceptional 47.8% |
| Celtics | 94.2 /100 | #100 | Exceptional 47.8% |
| Immigrants | Germany | 94.1 /100 | #101 | Exceptional 47.8% |
| Turks | 93.9 /100 | #102 | Exceptional 47.8% |
| Cypriots | 93.7 /100 | #103 | Exceptional 47.8% |
| Serbians | 93.6 /100 | #104 | Exceptional 47.8% |
| Immigrants | Singapore | 93.3 /100 | #105 | Exceptional 47.8% |
| Immigrants | Greece | 93.1 /100 | #106 | Exceptional 47.7% |
| Immigrants | Italy | 92.9 /100 | #107 | Exceptional 47.7% |
Demographics Similar to Immigrants from Northern Africa by Currently Married
In terms of currently married, the demographic groups most similar to Immigrants from Northern Africa are Brazilian (46.4%, a difference of 0.020%), Potawatomi (46.5%, a difference of 0.080%), Mongolian (46.4%, a difference of 0.080%), Immigrants from Chile (46.4%, a difference of 0.11%), and Ottawa (46.5%, a difference of 0.13%).
| Demographics | Rating | Rank | Currently Married |
| Hawaiians | 48.6 /100 | #176 | Average 46.6% |
| Israelis | 48.6 /100 | #177 | Average 46.6% |
| Chickasaw | 47.8 /100 | #178 | Average 46.6% |
| Immigrants | Oceania | 44.6 /100 | #179 | Average 46.5% |
| Costa Ricans | 43.7 /100 | #180 | Average 46.5% |
| Ottawa | 43.0 /100 | #181 | Average 46.5% |
| Potawatomi | 41.9 /100 | #182 | Average 46.5% |
| Immigrants | Northern Africa | 39.7 /100 | #183 | Fair 46.5% |
| Brazilians | 39.3 /100 | #184 | Fair 46.4% |
| Mongolians | 37.6 /100 | #185 | Fair 46.4% |
| Immigrants | Chile | 36.8 /100 | #186 | Fair 46.4% |
| Immigrants | Peru | 35.3 /100 | #187 | Fair 46.4% |
| Colombians | 31.8 /100 | #188 | Fair 46.3% |
| Fijians | 30.3 /100 | #189 | Fair 46.3% |
| Choctaw | 29.1 /100 | #190 | Fair 46.3% |