Immigrants from Portugal vs Immigrants from South America Currently Married
COMPARE
Immigrants from Portugal
Immigrants from South America
Currently Married
Currently Married Comparison
Immigrants from Portugal
Immigrants from South America
45.2%
CURRENTLY MARRIED
3.5/ 100
METRIC RATING
219th/ 347
METRIC RANK
45.7%
CURRENTLY MARRIED
10.8/ 100
METRIC RATING
207th/ 347
METRIC RANK
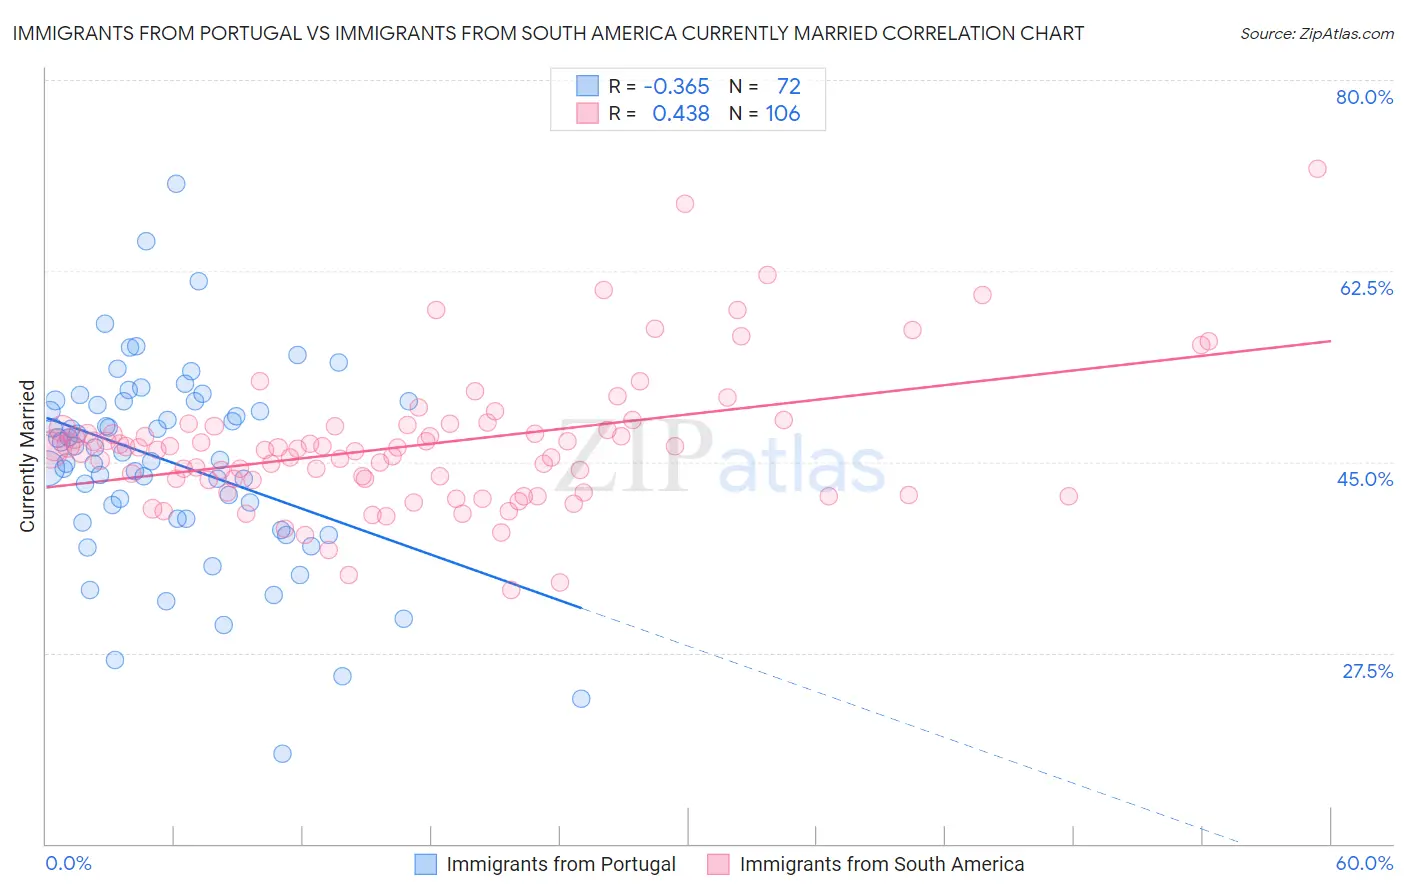
Immigrants from Portugal vs Immigrants from South America Currently Married Correlation Chart
The statistical analysis conducted on geographies consisting of 174,784,868 people shows a mild negative correlation between the proportion of Immigrants from Portugal and percentage of population currently married in the United States with a correlation coefficient (R) of -0.365 and weighted average of 45.2%. Similarly, the statistical analysis conducted on geographies consisting of 486,361,884 people shows a moderate positive correlation between the proportion of Immigrants from South America and percentage of population currently married in the United States with a correlation coefficient (R) of 0.438 and weighted average of 45.7%, a difference of 1.1%.
Currently Married Correlation Summary
| Measurement | Immigrants from Portugal | Immigrants from South America |
| Minimum | 18.3% | 33.3% |
| Maximum | 70.5% | 71.9% |
| Range | 52.2% | 38.6% |
| Mean | 44.9% | 46.5% |
| Median | 46.1% | 46.2% |
| Interquartile 25% (IQ1) | 39.8% | 43.3% |
| Interquartile 75% (IQ3) | 50.5% | 48.3% |
| Interquartile Range (IQR) | 10.8% | 4.9% |
| Standard Deviation (Sample) | 9.1% | 6.3% |
| Standard Deviation (Population) | 9.1% | 6.3% |
Demographics Similar to Immigrants from Portugal and Immigrants from South America by Currently Married
In terms of currently married, the demographic groups most similar to Immigrants from Portugal are Panamanian (45.3%, a difference of 0.12%), Kenyan (45.2%, a difference of 0.13%), Mexican (45.2%, a difference of 0.14%), Immigrants from the Azores (45.1%, a difference of 0.34%), and Immigrants from Thailand (45.4%, a difference of 0.36%). Similarly, the demographic groups most similar to Immigrants from South America are Alsatian (45.7%, a difference of 0.010%), Immigrants (45.8%, a difference of 0.040%), South American Indian (45.8%, a difference of 0.060%), Taiwanese (45.8%, a difference of 0.080%), and Immigrants from Spain (45.8%, a difference of 0.080%).
| Demographics | Rating | Rank | Currently Married |
| Taiwanese | 11.7 /100 | #203 | Poor 45.8% |
| Immigrants | Spain | 11.6 /100 | #204 | Poor 45.8% |
| South American Indians | 11.5 /100 | #205 | Poor 45.8% |
| Immigrants | Immigrants | 11.2 /100 | #206 | Poor 45.8% |
| Immigrants | South America | 10.8 /100 | #207 | Poor 45.7% |
| Alsatians | 10.8 /100 | #208 | Poor 45.7% |
| Immigrants | Micronesia | 8.8 /100 | #209 | Tragic 45.6% |
| Uruguayans | 7.9 /100 | #210 | Tragic 45.6% |
| Houma | 7.2 /100 | #211 | Tragic 45.5% |
| Marshallese | 7.2 /100 | #212 | Tragic 45.5% |
| Alaska Natives | 7.0 /100 | #213 | Tragic 45.5% |
| Dutch West Indians | 6.7 /100 | #214 | Tragic 45.5% |
| German Russians | 6.7 /100 | #215 | Tragic 45.5% |
| Immigrants | Morocco | 5.5 /100 | #216 | Tragic 45.4% |
| Immigrants | Thailand | 5.1 /100 | #217 | Tragic 45.4% |
| Panamanians | 4.0 /100 | #218 | Tragic 45.3% |
| Immigrants | Portugal | 3.5 /100 | #219 | Tragic 45.2% |
| Kenyans | 3.1 /100 | #220 | Tragic 45.2% |
| Mexicans | 3.0 /100 | #221 | Tragic 45.2% |
| Immigrants | Azores | 2.5 /100 | #222 | Tragic 45.1% |
| Immigrants | Laos | 2.3 /100 | #223 | Tragic 45.0% |