Celtic vs South American Currently Married
COMPARE
Celtic
South American
Currently Married
Currently Married Comparison
Celtics
South Americans
47.8%
CURRENTLY MARRIED
94.2/ 100
METRIC RATING
100th/ 347
METRIC RANK
46.1%
CURRENTLY MARRIED
23.8/ 100
METRIC RATING
194th/ 347
METRIC RANK
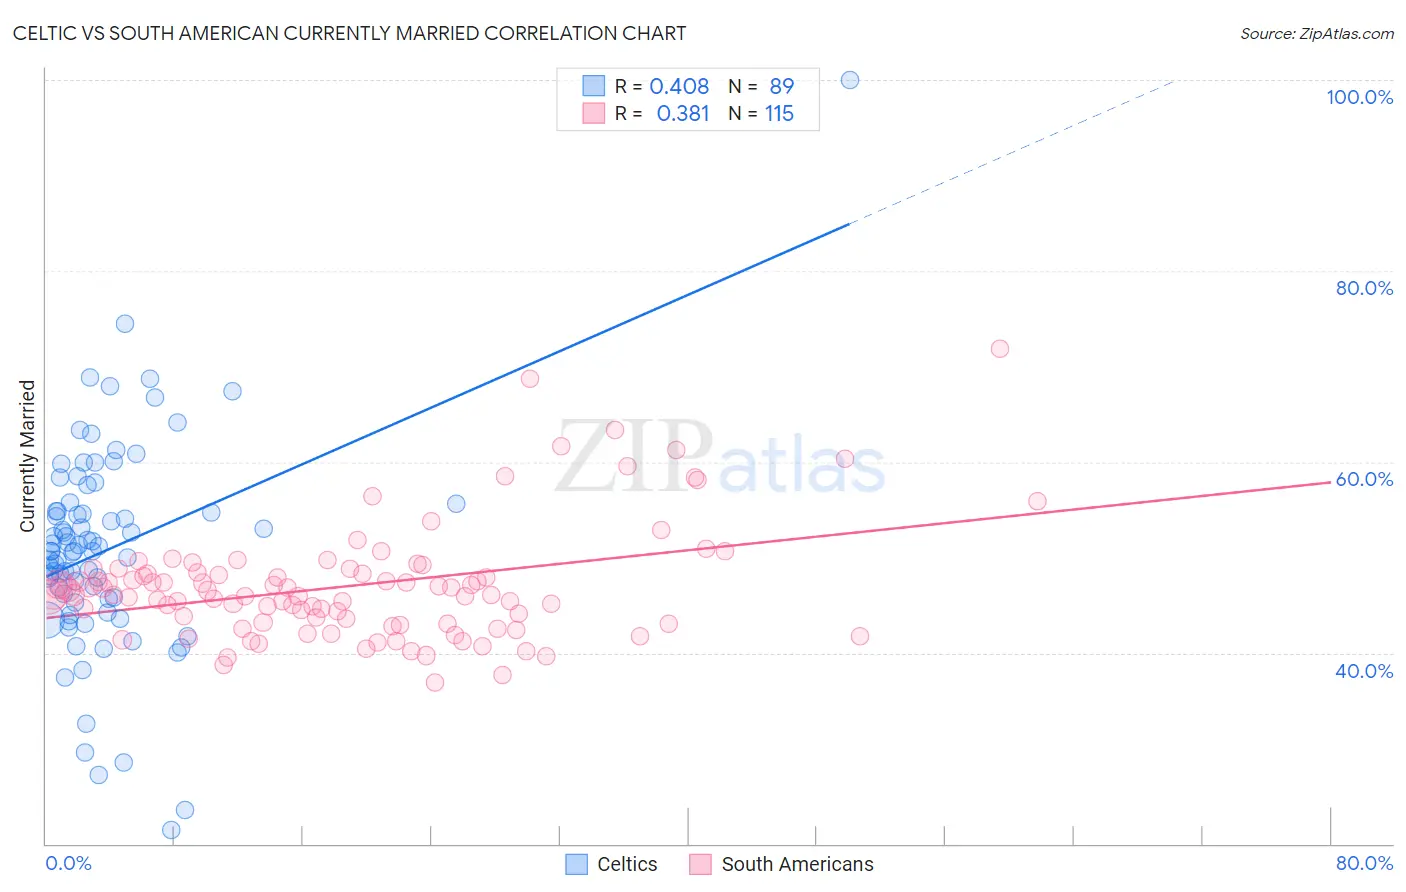
Celtic vs South American Currently Married Correlation Chart
The statistical analysis conducted on geographies consisting of 168,877,326 people shows a moderate positive correlation between the proportion of Celtics and percentage of population currently married in the United States with a correlation coefficient (R) of 0.408 and weighted average of 47.8%. Similarly, the statistical analysis conducted on geographies consisting of 494,081,354 people shows a mild positive correlation between the proportion of South Americans and percentage of population currently married in the United States with a correlation coefficient (R) of 0.381 and weighted average of 46.1%, a difference of 3.6%.
Currently Married Correlation Summary
| Measurement | Celtic | South American |
| Minimum | 21.4% | 37.0% |
| Maximum | 100.0% | 71.9% |
| Range | 78.6% | 34.9% |
| Mean | 50.8% | 47.0% |
| Median | 50.7% | 46.1% |
| Interquartile 25% (IQ1) | 45.4% | 43.1% |
| Interquartile 75% (IQ3) | 55.2% | 48.4% |
| Interquartile Range (IQR) | 9.8% | 5.3% |
| Standard Deviation (Sample) | 11.1% | 6.0% |
| Standard Deviation (Population) | 11.0% | 6.0% |
Similar Demographics by Currently Married
Demographics Similar to Celtics by Currently Married
In terms of currently married, the demographic groups most similar to Celtics are Immigrants from Sweden (47.8%, a difference of 0.020%), Immigrants from Germany (47.8%, a difference of 0.020%), Turkish (47.8%, a difference of 0.040%), Cypriot (47.8%, a difference of 0.070%), and Serbian (47.8%, a difference of 0.080%).
| Demographics | Rating | Rank | Currently Married |
| Lebanese | 95.1 /100 | #93 | Exceptional 47.9% |
| Native Hawaiians | 95.0 /100 | #94 | Exceptional 47.9% |
| Immigrants | Bulgaria | 94.8 /100 | #95 | Exceptional 47.9% |
| Egyptians | 94.8 /100 | #96 | Exceptional 47.9% |
| Immigrants | Ukraine | 94.8 /100 | #97 | Exceptional 47.9% |
| Immigrants | China | 94.7 /100 | #98 | Exceptional 47.9% |
| Immigrants | Sweden | 94.3 /100 | #99 | Exceptional 47.8% |
| Celtics | 94.2 /100 | #100 | Exceptional 47.8% |
| Immigrants | Germany | 94.1 /100 | #101 | Exceptional 47.8% |
| Turks | 93.9 /100 | #102 | Exceptional 47.8% |
| Cypriots | 93.7 /100 | #103 | Exceptional 47.8% |
| Serbians | 93.6 /100 | #104 | Exceptional 47.8% |
| Immigrants | Singapore | 93.3 /100 | #105 | Exceptional 47.8% |
| Immigrants | Greece | 93.1 /100 | #106 | Exceptional 47.7% |
| Immigrants | Italy | 92.9 /100 | #107 | Exceptional 47.7% |
Demographics Similar to South Americans by Currently Married
In terms of currently married, the demographic groups most similar to South Americans are Immigrants from Nepal (46.1%, a difference of 0.010%), Immigrants from Fiji (46.2%, a difference of 0.060%), Immigrants from Bosnia and Herzegovina (46.1%, a difference of 0.080%), Soviet Union (46.2%, a difference of 0.10%), and Immigrants from Kuwait (46.1%, a difference of 0.11%).
| Demographics | Rating | Rank | Currently Married |
| Immigrants | Peru | 35.3 /100 | #187 | Fair 46.4% |
| Colombians | 31.8 /100 | #188 | Fair 46.3% |
| Fijians | 30.3 /100 | #189 | Fair 46.3% |
| Choctaw | 29.1 /100 | #190 | Fair 46.3% |
| Immigrants | France | 27.7 /100 | #191 | Fair 46.2% |
| Soviet Union | 25.7 /100 | #192 | Fair 46.2% |
| Immigrants | Fiji | 25.0 /100 | #193 | Fair 46.2% |
| South Americans | 23.8 /100 | #194 | Fair 46.1% |
| Immigrants | Nepal | 23.7 /100 | #195 | Fair 46.1% |
| Immigrants | Bosnia and Herzegovina | 22.2 /100 | #196 | Fair 46.1% |
| Immigrants | Kuwait | 21.7 /100 | #197 | Fair 46.1% |
| Immigrants | Colombia | 21.0 /100 | #198 | Fair 46.1% |
| Immigrants | Costa Rica | 19.6 /100 | #199 | Poor 46.0% |
| Creek | 17.2 /100 | #200 | Poor 46.0% |
| Malaysians | 15.3 /100 | #201 | Poor 45.9% |