Cape Verdean vs Immigrants from South America Currently Married
COMPARE
Cape Verdean
Immigrants from South America
Currently Married
Currently Married Comparison
Cape Verdeans
Immigrants from South America
39.6%
CURRENTLY MARRIED
0.0/ 100
METRIC RATING
338th/ 347
METRIC RANK
45.7%
CURRENTLY MARRIED
10.8/ 100
METRIC RATING
207th/ 347
METRIC RANK
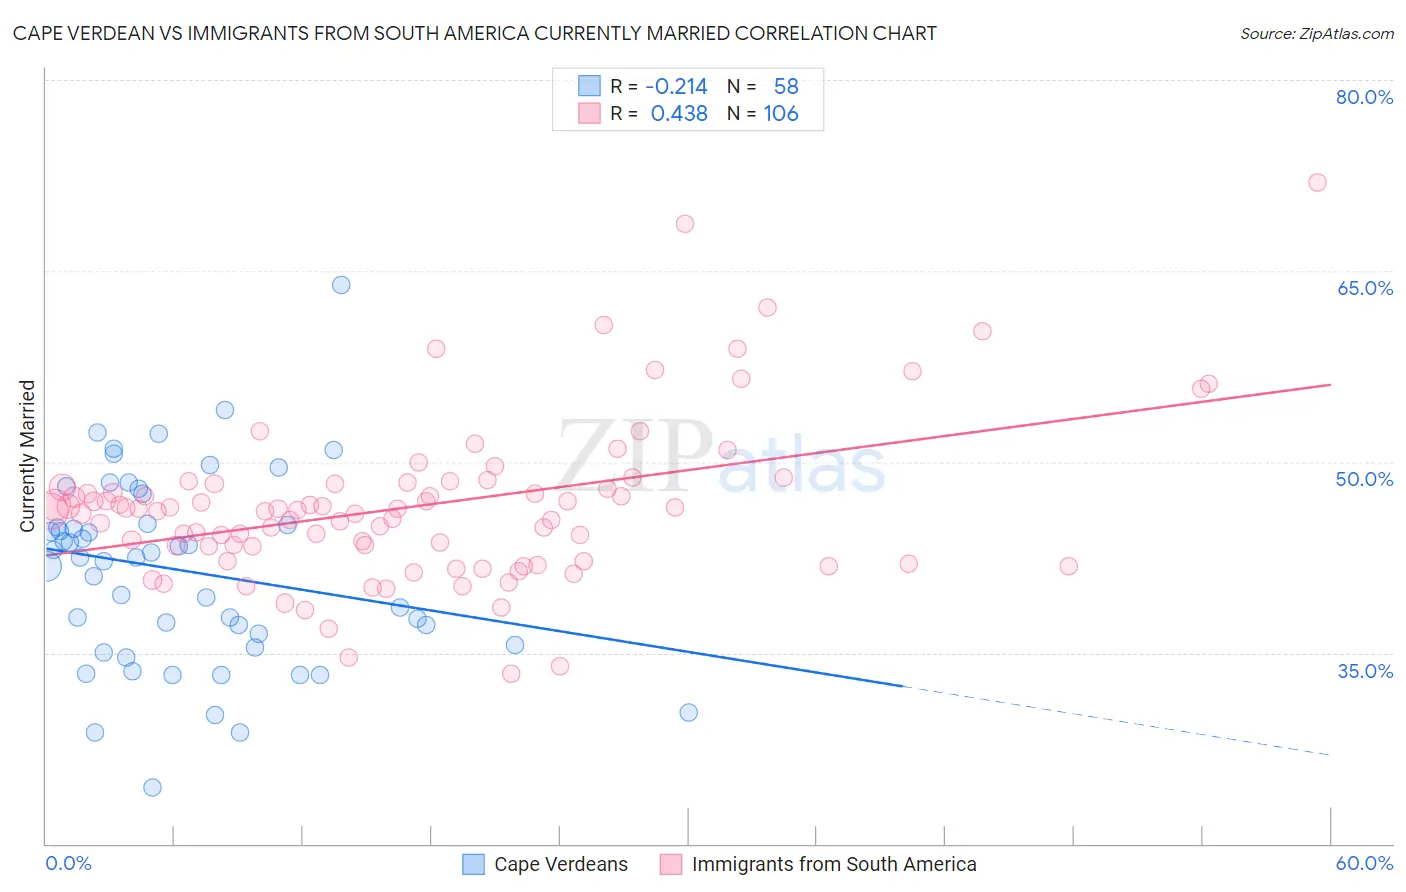
Cape Verdean vs Immigrants from South America Currently Married Correlation Chart
The statistical analysis conducted on geographies consisting of 107,578,938 people shows a weak negative correlation between the proportion of Cape Verdeans and percentage of population currently married in the United States with a correlation coefficient (R) of -0.214 and weighted average of 39.6%. Similarly, the statistical analysis conducted on geographies consisting of 486,361,884 people shows a moderate positive correlation between the proportion of Immigrants from South America and percentage of population currently married in the United States with a correlation coefficient (R) of 0.438 and weighted average of 45.7%, a difference of 15.5%.
Currently Married Correlation Summary
| Measurement | Cape Verdean | Immigrants from South America |
| Minimum | 24.4% | 33.3% |
| Maximum | 63.9% | 71.9% |
| Range | 39.5% | 38.6% |
| Mean | 41.5% | 46.5% |
| Median | 42.5% | 46.2% |
| Interquartile 25% (IQ1) | 35.6% | 43.3% |
| Interquartile 75% (IQ3) | 45.1% | 48.3% |
| Interquartile Range (IQR) | 9.5% | 4.9% |
| Standard Deviation (Sample) | 7.5% | 6.3% |
| Standard Deviation (Population) | 7.4% | 6.3% |
Similar Demographics by Currently Married
Demographics Similar to Cape Verdeans by Currently Married
In terms of currently married, the demographic groups most similar to Cape Verdeans are Black/African American (39.6%, a difference of 0.090%), Dominican (39.5%, a difference of 0.15%), British West Indian (39.8%, a difference of 0.47%), Lumbee (39.8%, a difference of 0.65%), and Puerto Rican (39.9%, a difference of 0.81%).
| Demographics | Rating | Rank | Currently Married |
| Immigrants | Barbados | 0.0 /100 | #331 | Tragic 40.3% |
| Immigrants | St. Vincent and the Grenadines | 0.0 /100 | #332 | Tragic 40.1% |
| Yup'ik | 0.0 /100 | #333 | Tragic 39.9% |
| Puerto Ricans | 0.0 /100 | #334 | Tragic 39.9% |
| Lumbee | 0.0 /100 | #335 | Tragic 39.8% |
| British West Indians | 0.0 /100 | #336 | Tragic 39.8% |
| Blacks/African Americans | 0.0 /100 | #337 | Tragic 39.6% |
| Cape Verdeans | 0.0 /100 | #338 | Tragic 39.6% |
| Dominicans | 0.0 /100 | #339 | Tragic 39.5% |
| Immigrants | Grenada | 0.0 /100 | #340 | Tragic 39.1% |
| Navajo | 0.0 /100 | #341 | Tragic 39.0% |
| Immigrants | Dominican Republic | 0.0 /100 | #342 | Tragic 38.9% |
| Pueblo | 0.0 /100 | #343 | Tragic 38.2% |
| Immigrants | Cabo Verde | 0.0 /100 | #344 | Tragic 37.8% |
| Tohono O'odham | 0.0 /100 | #345 | Tragic 36.8% |
Demographics Similar to Immigrants from South America by Currently Married
In terms of currently married, the demographic groups most similar to Immigrants from South America are Alsatian (45.7%, a difference of 0.010%), Immigrants (45.8%, a difference of 0.040%), South American Indian (45.8%, a difference of 0.060%), Taiwanese (45.8%, a difference of 0.080%), and Immigrants from Spain (45.8%, a difference of 0.080%).
| Demographics | Rating | Rank | Currently Married |
| Creek | 17.2 /100 | #200 | Poor 46.0% |
| Malaysians | 15.3 /100 | #201 | Poor 45.9% |
| Immigrants | Albania | 14.5 /100 | #202 | Poor 45.9% |
| Taiwanese | 11.7 /100 | #203 | Poor 45.8% |
| Immigrants | Spain | 11.6 /100 | #204 | Poor 45.8% |
| South American Indians | 11.5 /100 | #205 | Poor 45.8% |
| Immigrants | Immigrants | 11.2 /100 | #206 | Poor 45.8% |
| Immigrants | South America | 10.8 /100 | #207 | Poor 45.7% |
| Alsatians | 10.8 /100 | #208 | Poor 45.7% |
| Immigrants | Micronesia | 8.8 /100 | #209 | Tragic 45.6% |
| Uruguayans | 7.9 /100 | #210 | Tragic 45.6% |
| Houma | 7.2 /100 | #211 | Tragic 45.5% |
| Marshallese | 7.2 /100 | #212 | Tragic 45.5% |
| Alaska Natives | 7.0 /100 | #213 | Tragic 45.5% |
| Dutch West Indians | 6.7 /100 | #214 | Tragic 45.5% |