British vs Immigrants from Zimbabwe Average Family Size
COMPARE
British
Immigrants from Zimbabwe
Average Family Size
Average Family Size Comparison
British
Immigrants from Zimbabwe
3.13
AVERAGE FAMILY SIZE
0.2/ 100
METRIC RATING
303rd/ 347
METRIC RANK
3.19
AVERAGE FAMILY SIZE
7.1/ 100
METRIC RATING
223rd/ 347
METRIC RANK
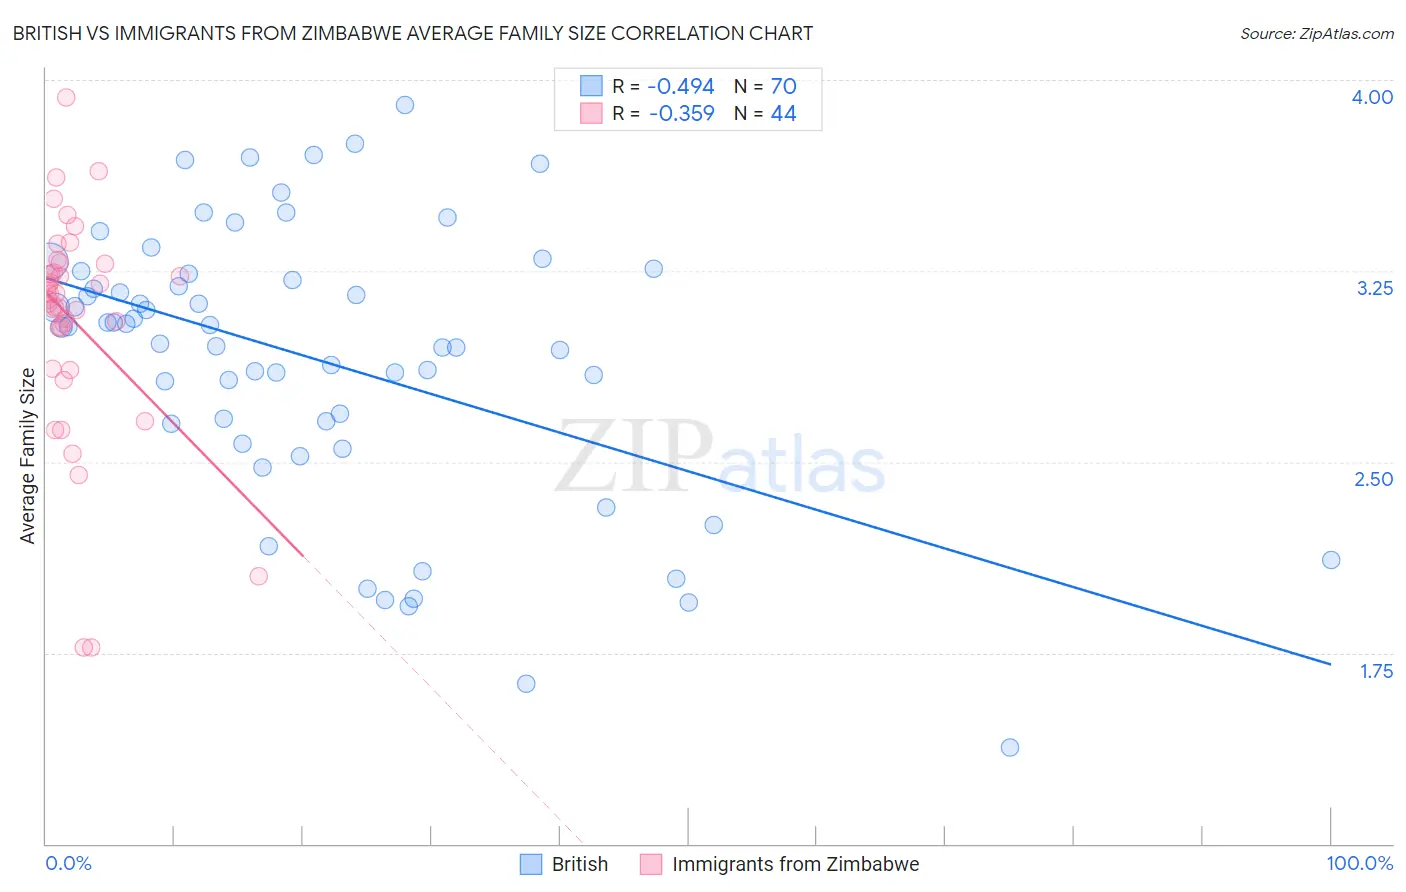
British vs Immigrants from Zimbabwe Average Family Size Correlation Chart
The statistical analysis conducted on geographies consisting of 531,009,581 people shows a moderate negative correlation between the proportion of British and average family size in the United States with a correlation coefficient (R) of -0.494 and weighted average of 3.13. Similarly, the statistical analysis conducted on geographies consisting of 117,791,116 people shows a mild negative correlation between the proportion of Immigrants from Zimbabwe and average family size in the United States with a correlation coefficient (R) of -0.359 and weighted average of 3.19, a difference of 1.8%.
Average Family Size Correlation Summary
| Measurement | British | Immigrants from Zimbabwe |
| Minimum | 1.38 | 1.77 |
| Maximum | 3.90 | 3.93 |
| Range | 2.52 | 2.16 |
| Mean | 2.90 | 3.05 |
| Median | 3.03 | 3.15 |
| Interquartile 25% (IQ1) | 2.65 | 2.95 |
| Interquartile 75% (IQ3) | 3.24 | 3.26 |
| Interquartile Range (IQR) | 0.59 | 0.31 |
| Standard Deviation (Sample) | 0.54 | 0.44 |
| Standard Deviation (Population) | 0.54 | 0.43 |
Similar Demographics by Average Family Size
Demographics Similar to British by Average Family Size
In terms of average family size, the demographic groups most similar to British are Macedonian (3.13, a difference of 0.010%), Immigrants from Latvia (3.13, a difference of 0.010%), Immigrants from Switzerland (3.13, a difference of 0.020%), Australian (3.13, a difference of 0.050%), and Immigrants from Sweden (3.14, a difference of 0.080%).
| Demographics | Rating | Rank | Average Family Size |
| Ukrainians | 0.2 /100 | #296 | Tragic 3.14 |
| Immigrants | Western Europe | 0.2 /100 | #297 | Tragic 3.14 |
| Colville | 0.2 /100 | #298 | Tragic 3.14 |
| Canadians | 0.2 /100 | #299 | Tragic 3.14 |
| Immigrants | Sweden | 0.2 /100 | #300 | Tragic 3.14 |
| Macedonians | 0.2 /100 | #301 | Tragic 3.13 |
| Immigrants | Latvia | 0.2 /100 | #302 | Tragic 3.13 |
| British | 0.2 /100 | #303 | Tragic 3.13 |
| Immigrants | Switzerland | 0.2 /100 | #304 | Tragic 3.13 |
| Australians | 0.1 /100 | #305 | Tragic 3.13 |
| Immigrants | Ireland | 0.1 /100 | #306 | Tragic 3.13 |
| Immigrants | Serbia | 0.1 /100 | #307 | Tragic 3.13 |
| Slavs | 0.1 /100 | #308 | Tragic 3.13 |
| Northern Europeans | 0.1 /100 | #309 | Tragic 3.13 |
| Czechoslovakians | 0.1 /100 | #310 | Tragic 3.13 |
Demographics Similar to Immigrants from Zimbabwe by Average Family Size
In terms of average family size, the demographic groups most similar to Immigrants from Zimbabwe are Immigrants from Ukraine (3.19, a difference of 0.010%), Immigrants from Kuwait (3.19, a difference of 0.010%), Syrian (3.19, a difference of 0.040%), Cree (3.19, a difference of 0.060%), and Chickasaw (3.19, a difference of 0.080%).
| Demographics | Rating | Rank | Average Family Size |
| Bermudans | 11.0 /100 | #216 | Poor 3.20 |
| Immigrants | Somalia | 10.3 /100 | #217 | Poor 3.20 |
| French American Indians | 9.8 /100 | #218 | Tragic 3.20 |
| Pennsylvania Germans | 9.3 /100 | #219 | Tragic 3.19 |
| Lebanese | 9.1 /100 | #220 | Tragic 3.19 |
| Immigrants | Ukraine | 7.2 /100 | #221 | Tragic 3.19 |
| Immigrants | Kuwait | 7.2 /100 | #222 | Tragic 3.19 |
| Immigrants | Zimbabwe | 7.1 /100 | #223 | Tragic 3.19 |
| Syrians | 6.5 /100 | #224 | Tragic 3.19 |
| Cree | 6.2 /100 | #225 | Tragic 3.19 |
| Chickasaw | 6.0 /100 | #226 | Tragic 3.19 |
| Portuguese | 6.0 /100 | #227 | Tragic 3.19 |
| Immigrants | Nonimmigrants | 5.7 /100 | #228 | Tragic 3.19 |
| Immigrants | Italy | 5.3 /100 | #229 | Tragic 3.19 |
| Icelanders | 5.2 /100 | #230 | Tragic 3.19 |