British vs Immigrants from Zimbabwe Disability
COMPARE
British
Immigrants from Zimbabwe
Disability
Disability Comparison
British
Immigrants from Zimbabwe
12.2%
DISABILITY
1.5/ 100
METRIC RATING
243rd/ 347
METRIC RANK
11.2%
DISABILITY
97.7/ 100
METRIC RATING
96th/ 347
METRIC RANK
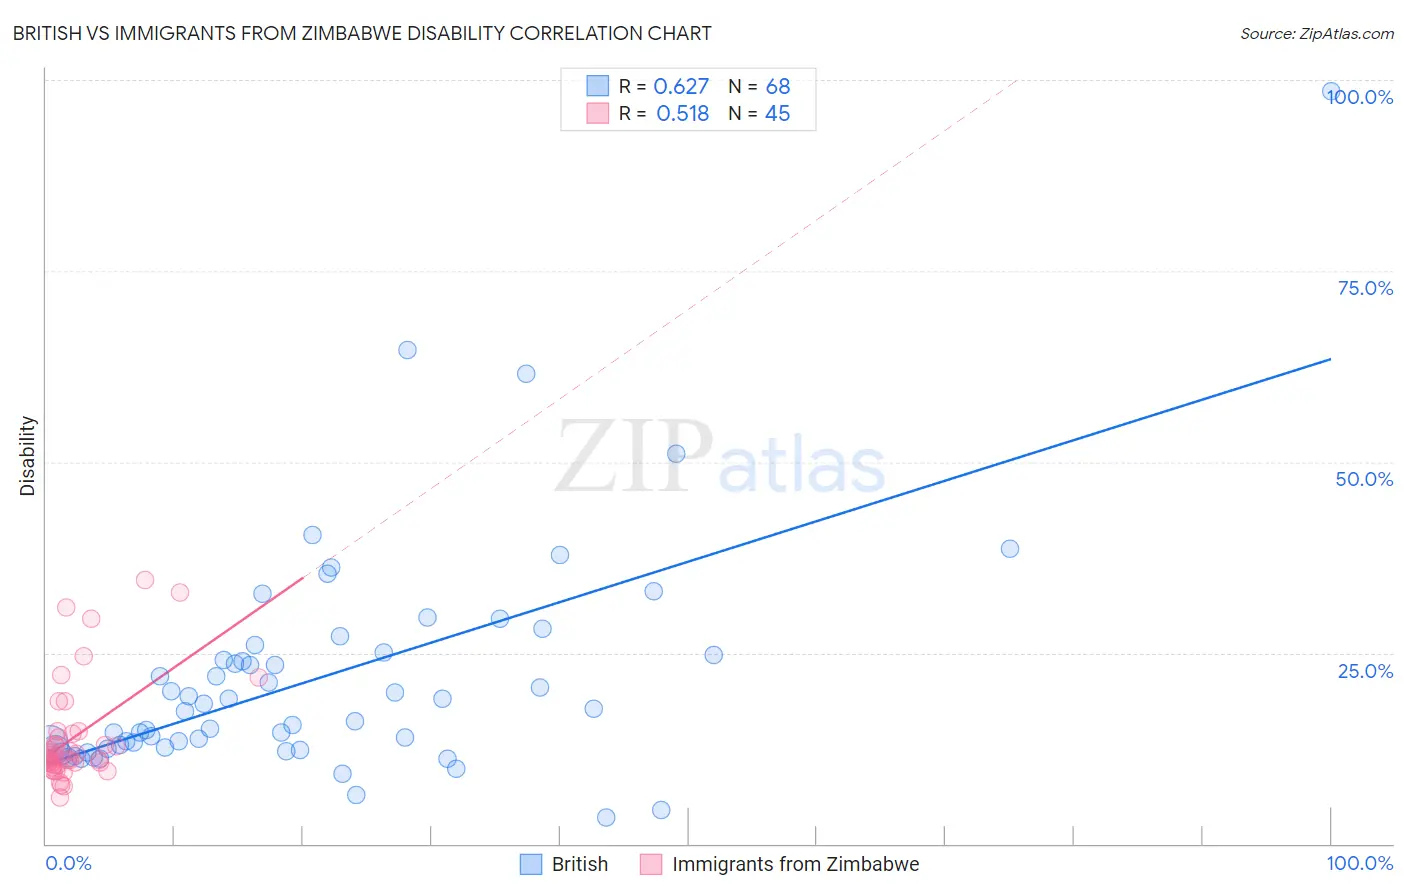
British vs Immigrants from Zimbabwe Disability Correlation Chart
The statistical analysis conducted on geographies consisting of 531,410,774 people shows a significant positive correlation between the proportion of British and percentage of population with a disability in the United States with a correlation coefficient (R) of 0.627 and weighted average of 12.2%. Similarly, the statistical analysis conducted on geographies consisting of 117,811,859 people shows a substantial positive correlation between the proportion of Immigrants from Zimbabwe and percentage of population with a disability in the United States with a correlation coefficient (R) of 0.518 and weighted average of 11.2%, a difference of 9.1%.
Disability Correlation Summary
| Measurement | British | Immigrants from Zimbabwe |
| Minimum | 3.5% | 6.0% |
| Maximum | 98.5% | 34.6% |
| Range | 95.0% | 28.6% |
| Mean | 21.7% | 14.0% |
| Median | 17.5% | 11.5% |
| Interquartile 25% (IQ1) | 12.6% | 10.3% |
| Interquartile 75% (IQ3) | 24.8% | 14.6% |
| Interquartile Range (IQR) | 12.3% | 4.3% |
| Standard Deviation (Sample) | 15.1% | 6.8% |
| Standard Deviation (Population) | 15.0% | 6.8% |
Similar Demographics by Disability
Demographics Similar to British by Disability
In terms of disability, the demographic groups most similar to British are Basque (12.2%, a difference of 0.0%), Liberian (12.2%, a difference of 0.020%), Swiss (12.2%, a difference of 0.040%), Indonesian (12.2%, a difference of 0.070%), and Polish (12.2%, a difference of 0.090%).
| Demographics | Rating | Rank | Disability |
| Chinese | 2.0 /100 | #236 | Tragic 12.2% |
| Immigrants | Congo | 1.9 /100 | #237 | Tragic 12.2% |
| Norwegians | 1.9 /100 | #238 | Tragic 12.2% |
| Swedes | 1.8 /100 | #239 | Tragic 12.2% |
| Hungarians | 1.7 /100 | #240 | Tragic 12.2% |
| Yugoslavians | 1.7 /100 | #241 | Tragic 12.2% |
| Poles | 1.7 /100 | #242 | Tragic 12.2% |
| British | 1.5 /100 | #243 | Tragic 12.2% |
| Basques | 1.5 /100 | #244 | Tragic 12.2% |
| Liberians | 1.5 /100 | #245 | Tragic 12.2% |
| Swiss | 1.5 /100 | #246 | Tragic 12.2% |
| Indonesians | 1.4 /100 | #247 | Tragic 12.2% |
| Guamanians/Chamorros | 1.4 /100 | #248 | Tragic 12.3% |
| Carpatho Rusyns | 1.4 /100 | #249 | Tragic 12.3% |
| Sub-Saharan Africans | 1.4 /100 | #250 | Tragic 12.3% |
Demographics Similar to Immigrants from Zimbabwe by Disability
In terms of disability, the demographic groups most similar to Immigrants from Zimbabwe are Eastern European (11.2%, a difference of 0.060%), Immigrants from Morocco (11.2%, a difference of 0.070%), Bhutanese (11.2%, a difference of 0.14%), Uruguayan (11.2%, a difference of 0.14%), and Immigrants from Czechoslovakia (11.2%, a difference of 0.15%).
| Demographics | Rating | Rank | Disability |
| Immigrants | South Africa | 98.2 /100 | #89 | Exceptional 11.2% |
| Immigrants | Brazil | 98.1 /100 | #90 | Exceptional 11.2% |
| Immigrants | Western Asia | 98.1 /100 | #91 | Exceptional 11.2% |
| Ecuadorians | 98.0 /100 | #92 | Exceptional 11.2% |
| Immigrants | Ecuador | 98.0 /100 | #93 | Exceptional 11.2% |
| Immigrants | Morocco | 97.8 /100 | #94 | Exceptional 11.2% |
| Eastern Europeans | 97.8 /100 | #95 | Exceptional 11.2% |
| Immigrants | Zimbabwe | 97.7 /100 | #96 | Exceptional 11.2% |
| Bhutanese | 97.4 /100 | #97 | Exceptional 11.2% |
| Uruguayans | 97.4 /100 | #98 | Exceptional 11.2% |
| Immigrants | Czechoslovakia | 97.4 /100 | #99 | Exceptional 11.2% |
| Immigrants | Greece | 96.9 /100 | #100 | Exceptional 11.3% |
| Immigrants | Nicaragua | 96.8 /100 | #101 | Exceptional 11.3% |
| Immigrants | Eastern Africa | 96.7 /100 | #102 | Exceptional 11.3% |
| Immigrants | Uruguay | 96.4 /100 | #103 | Exceptional 11.3% |