British vs Indian (Asian) Average Family Size
COMPARE
British
Indian (Asian)
Average Family Size
Average Family Size Comparison
British
Indians (Asian)
3.13
AVERAGE FAMILY SIZE
0.2/ 100
METRIC RATING
303rd/ 347
METRIC RANK
3.24
AVERAGE FAMILY SIZE
73.6/ 100
METRIC RATING
150th/ 347
METRIC RANK
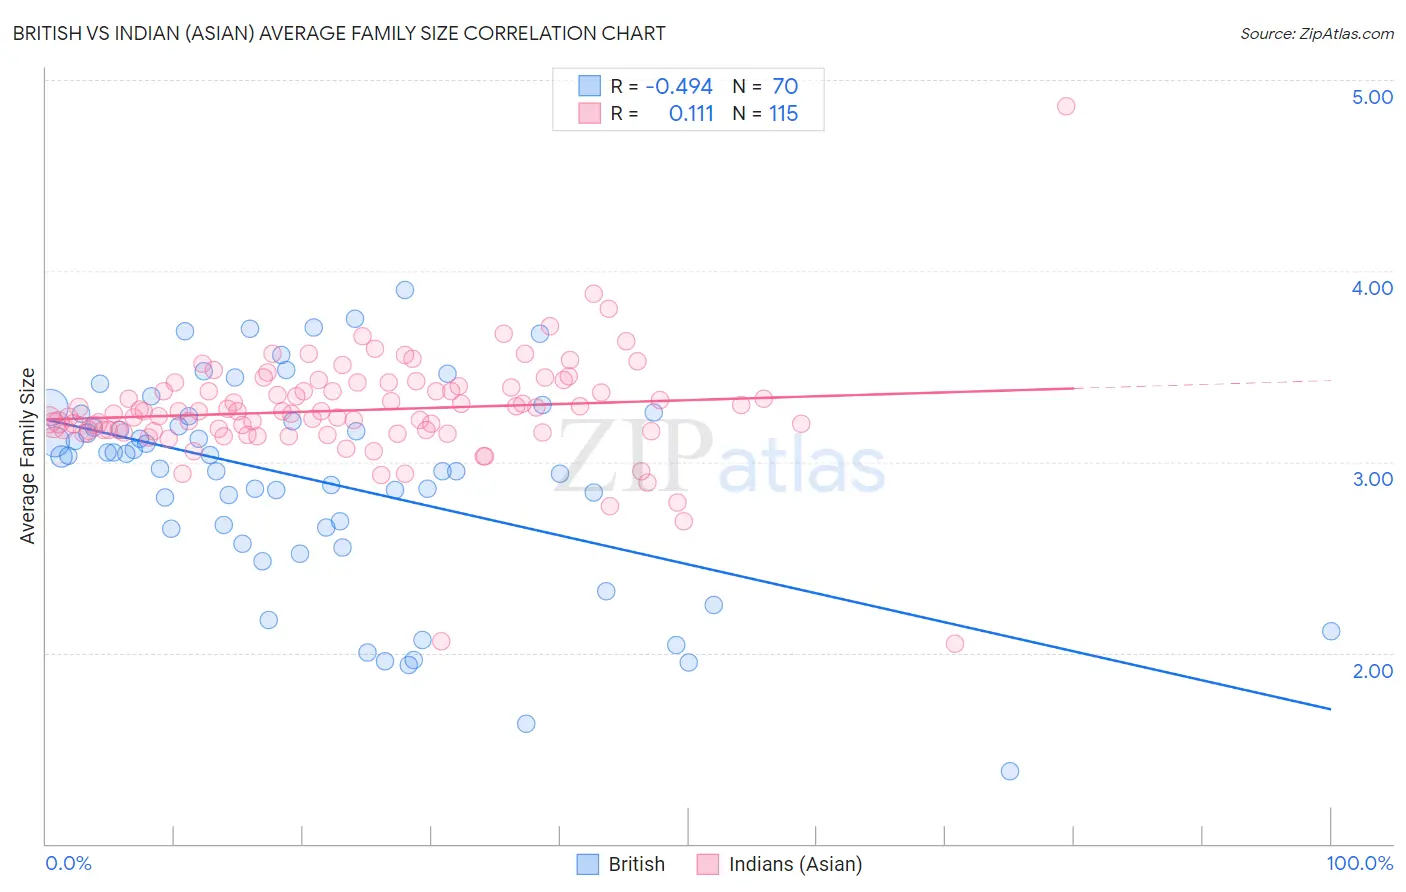
British vs Indian (Asian) Average Family Size Correlation Chart
The statistical analysis conducted on geographies consisting of 531,009,581 people shows a moderate negative correlation between the proportion of British and average family size in the United States with a correlation coefficient (R) of -0.494 and weighted average of 3.13. Similarly, the statistical analysis conducted on geographies consisting of 494,783,679 people shows a poor positive correlation between the proportion of Indians (Asian) and average family size in the United States with a correlation coefficient (R) of 0.111 and weighted average of 3.24, a difference of 3.5%.
Average Family Size Correlation Summary
| Measurement | British | Indian (Asian) |
| Minimum | 1.38 | 2.05 |
| Maximum | 3.90 | 4.86 |
| Range | 2.52 | 2.81 |
| Mean | 2.90 | 3.27 |
| Median | 3.03 | 3.26 |
| Interquartile 25% (IQ1) | 2.65 | 3.16 |
| Interquartile 75% (IQ3) | 3.24 | 3.40 |
| Interquartile Range (IQR) | 0.59 | 0.24 |
| Standard Deviation (Sample) | 0.54 | 0.30 |
| Standard Deviation (Population) | 0.54 | 0.29 |
Similar Demographics by Average Family Size
Demographics Similar to British by Average Family Size
In terms of average family size, the demographic groups most similar to British are Macedonian (3.13, a difference of 0.010%), Immigrants from Latvia (3.13, a difference of 0.010%), Immigrants from Switzerland (3.13, a difference of 0.020%), Australian (3.13, a difference of 0.050%), and Immigrants from Sweden (3.14, a difference of 0.080%).
| Demographics | Rating | Rank | Average Family Size |
| Ukrainians | 0.2 /100 | #296 | Tragic 3.14 |
| Immigrants | Western Europe | 0.2 /100 | #297 | Tragic 3.14 |
| Colville | 0.2 /100 | #298 | Tragic 3.14 |
| Canadians | 0.2 /100 | #299 | Tragic 3.14 |
| Immigrants | Sweden | 0.2 /100 | #300 | Tragic 3.14 |
| Macedonians | 0.2 /100 | #301 | Tragic 3.13 |
| Immigrants | Latvia | 0.2 /100 | #302 | Tragic 3.13 |
| British | 0.2 /100 | #303 | Tragic 3.13 |
| Immigrants | Switzerland | 0.2 /100 | #304 | Tragic 3.13 |
| Australians | 0.1 /100 | #305 | Tragic 3.13 |
| Immigrants | Ireland | 0.1 /100 | #306 | Tragic 3.13 |
| Immigrants | Serbia | 0.1 /100 | #307 | Tragic 3.13 |
| Slavs | 0.1 /100 | #308 | Tragic 3.13 |
| Northern Europeans | 0.1 /100 | #309 | Tragic 3.13 |
| Czechoslovakians | 0.1 /100 | #310 | Tragic 3.13 |
Demographics Similar to Indians (Asian) by Average Family Size
In terms of average family size, the demographic groups most similar to Indians (Asian) are Assyrian/Chaldean/Syriac (3.24, a difference of 0.0%), Jordanian (3.24, a difference of 0.0%), Blackfeet (3.24, a difference of 0.030%), Spanish American (3.24, a difference of 0.030%), and Immigrants from Jordan (3.24, a difference of 0.050%).
| Demographics | Rating | Rank | Average Family Size |
| Bhutanese | 81.0 /100 | #143 | Excellent 3.25 |
| Tsimshian | 80.2 /100 | #144 | Excellent 3.25 |
| Armenians | 78.2 /100 | #145 | Good 3.25 |
| Immigrants | Africa | 77.9 /100 | #146 | Good 3.25 |
| Immigrants | Jordan | 75.7 /100 | #147 | Good 3.24 |
| Blackfeet | 75.0 /100 | #148 | Good 3.24 |
| Assyrians/Chaldeans/Syriacs | 73.8 /100 | #149 | Good 3.24 |
| Indians (Asian) | 73.6 /100 | #150 | Good 3.24 |
| Jordanians | 73.5 /100 | #151 | Good 3.24 |
| Spanish Americans | 72.5 /100 | #152 | Good 3.24 |
| Immigrants | Eritrea | 71.4 /100 | #153 | Good 3.24 |
| Immigrants | Egypt | 70.0 /100 | #154 | Good 3.24 |
| Seminole | 68.2 /100 | #155 | Good 3.24 |
| Immigrants | Taiwan | 68.1 /100 | #156 | Good 3.24 |
| Immigrants | Uzbekistan | 67.0 /100 | #157 | Good 3.24 |