British vs Immigrants from Zimbabwe Householder Income Ages 45 - 64 years
COMPARE
British
Immigrants from Zimbabwe
Householder Income Ages 45 - 64 years
Householder Income Ages 45 - 64 years Comparison
British
Immigrants from Zimbabwe
$106,264
HOUSEHOLDER INCOME AGES 45 - 64 YEARS
95.2/ 100
METRIC RATING
116th/ 347
METRIC RANK
$104,992
HOUSEHOLDER INCOME AGES 45 - 64 YEARS
91.2/ 100
METRIC RATING
130th/ 347
METRIC RANK
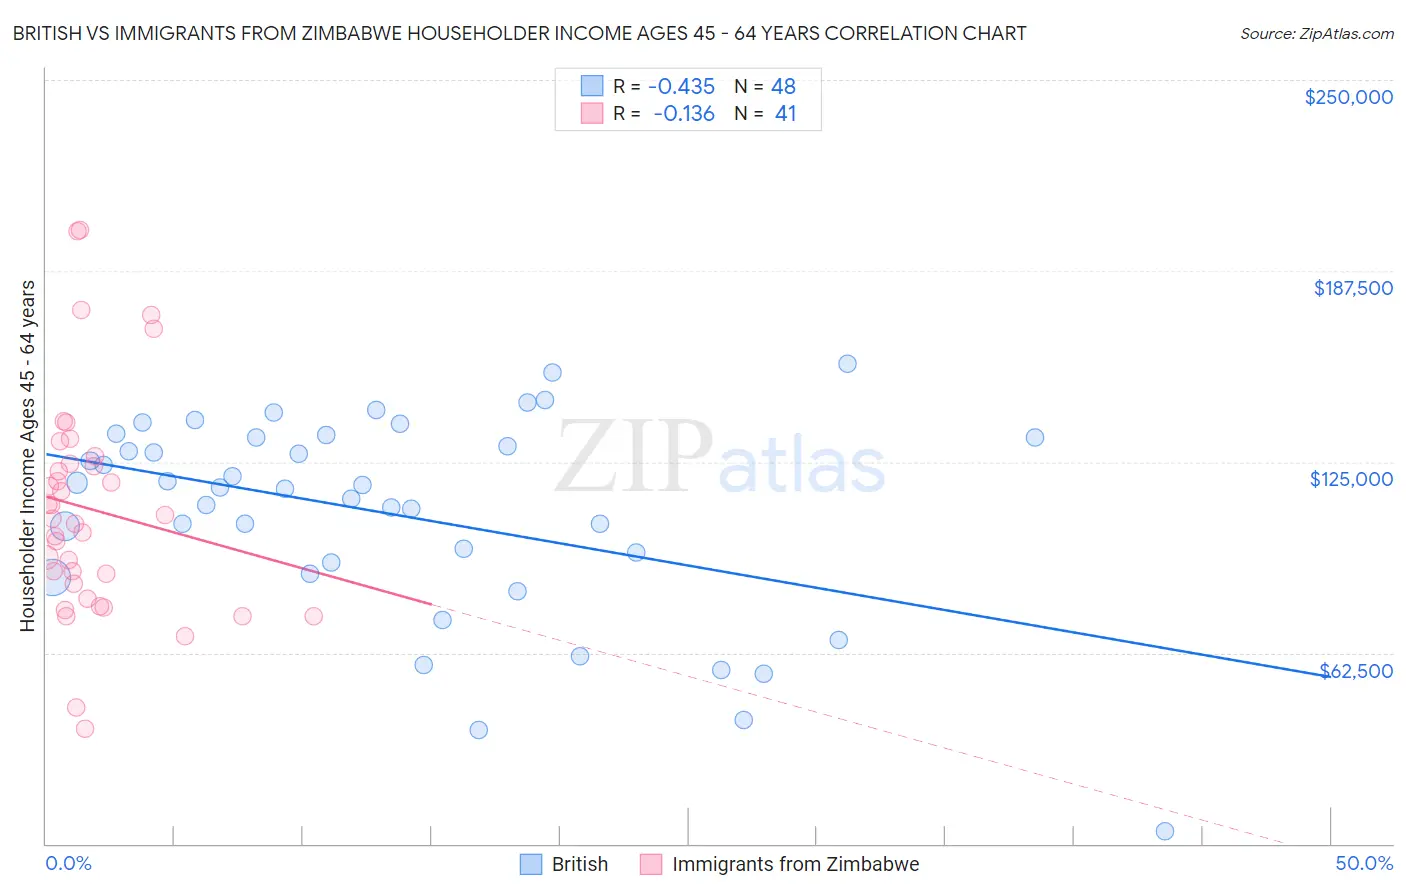
British vs Immigrants from Zimbabwe Householder Income Ages 45 - 64 years Correlation Chart
The statistical analysis conducted on geographies consisting of 529,409,230 people shows a moderate negative correlation between the proportion of British and household income with householder between the ages 45 and 64 in the United States with a correlation coefficient (R) of -0.435 and weighted average of $106,264. Similarly, the statistical analysis conducted on geographies consisting of 117,765,117 people shows a poor negative correlation between the proportion of Immigrants from Zimbabwe and household income with householder between the ages 45 and 64 in the United States with a correlation coefficient (R) of -0.136 and weighted average of $104,992, a difference of 1.2%.
Householder Income Ages 45 - 64 years Correlation Summary
| Measurement | British | Immigrants from Zimbabwe |
| Minimum | $3,946 | $37,639 |
| Maximum | $157,159 | $200,729 |
| Range | $153,213 | $163,090 |
| Mean | $107,499 | $109,509 |
| Median | $116,378 | $106,206 |
| Interquartile 25% (IQ1) | $90,097 | $82,572 |
| Interquartile 75% (IQ3) | $132,967 | $125,652 |
| Interquartile Range (IQR) | $42,871 | $43,080 |
| Standard Deviation (Sample) | $33,617 | $36,656 |
| Standard Deviation (Population) | $33,265 | $36,206 |
Demographics Similar to British and Immigrants from Zimbabwe by Householder Income Ages 45 - 64 years
In terms of householder income ages 45 - 64 years, the demographic groups most similar to British are Immigrants from Kuwait ($106,285, a difference of 0.020%), Albanian ($106,243, a difference of 0.020%), Immigrants from Western Asia ($106,217, a difference of 0.040%), Immigrants from Poland ($106,319, a difference of 0.050%), and Immigrants from Jordan ($106,164, a difference of 0.090%). Similarly, the demographic groups most similar to Immigrants from Zimbabwe are Peruvian ($105,070, a difference of 0.070%), Immigrants from Syria ($104,858, a difference of 0.13%), Native Hawaiian ($105,149, a difference of 0.15%), Immigrants from Saudi Arabia ($105,249, a difference of 0.24%), and Lebanese ($104,734, a difference of 0.25%).
| Demographics | Rating | Rank | Householder Income Ages 45 - 64 years |
| Europeans | 95.4 /100 | #113 | Exceptional $106,367 |
| Immigrants | Poland | 95.3 /100 | #114 | Exceptional $106,319 |
| Immigrants | Kuwait | 95.2 /100 | #115 | Exceptional $106,285 |
| British | 95.2 /100 | #116 | Exceptional $106,264 |
| Albanians | 95.1 /100 | #117 | Exceptional $106,243 |
| Immigrants | Western Asia | 95.0 /100 | #118 | Exceptional $106,217 |
| Immigrants | Jordan | 94.9 /100 | #119 | Exceptional $106,164 |
| Immigrants | South Eastern Asia | 94.8 /100 | #120 | Exceptional $106,109 |
| Poles | 94.4 /100 | #121 | Exceptional $105,952 |
| Immigrants | North Macedonia | 94.2 /100 | #122 | Exceptional $105,892 |
| Danes | 93.4 /100 | #123 | Exceptional $105,619 |
| Immigrants | Northern Africa | 92.8 /100 | #124 | Exceptional $105,430 |
| Pakistanis | 92.4 /100 | #125 | Exceptional $105,317 |
| Portuguese | 92.4 /100 | #126 | Exceptional $105,309 |
| Immigrants | Saudi Arabia | 92.2 /100 | #127 | Exceptional $105,249 |
| Native Hawaiians | 91.8 /100 | #128 | Exceptional $105,149 |
| Peruvians | 91.5 /100 | #129 | Exceptional $105,070 |
| Immigrants | Zimbabwe | 91.2 /100 | #130 | Exceptional $104,992 |
| Immigrants | Syria | 90.7 /100 | #131 | Exceptional $104,858 |
| Lebanese | 90.1 /100 | #132 | Exceptional $104,734 |
| Arabs | 89.3 /100 | #133 | Excellent $104,566 |