British vs Immigrants from Armenia Average Family Size
COMPARE
British
Immigrants from Armenia
Average Family Size
Average Family Size Comparison
British
Immigrants from Armenia
3.13
AVERAGE FAMILY SIZE
0.2/ 100
METRIC RATING
303rd/ 347
METRIC RANK
3.35
AVERAGE FAMILY SIZE
100.0/ 100
METRIC RATING
60th/ 347
METRIC RANK
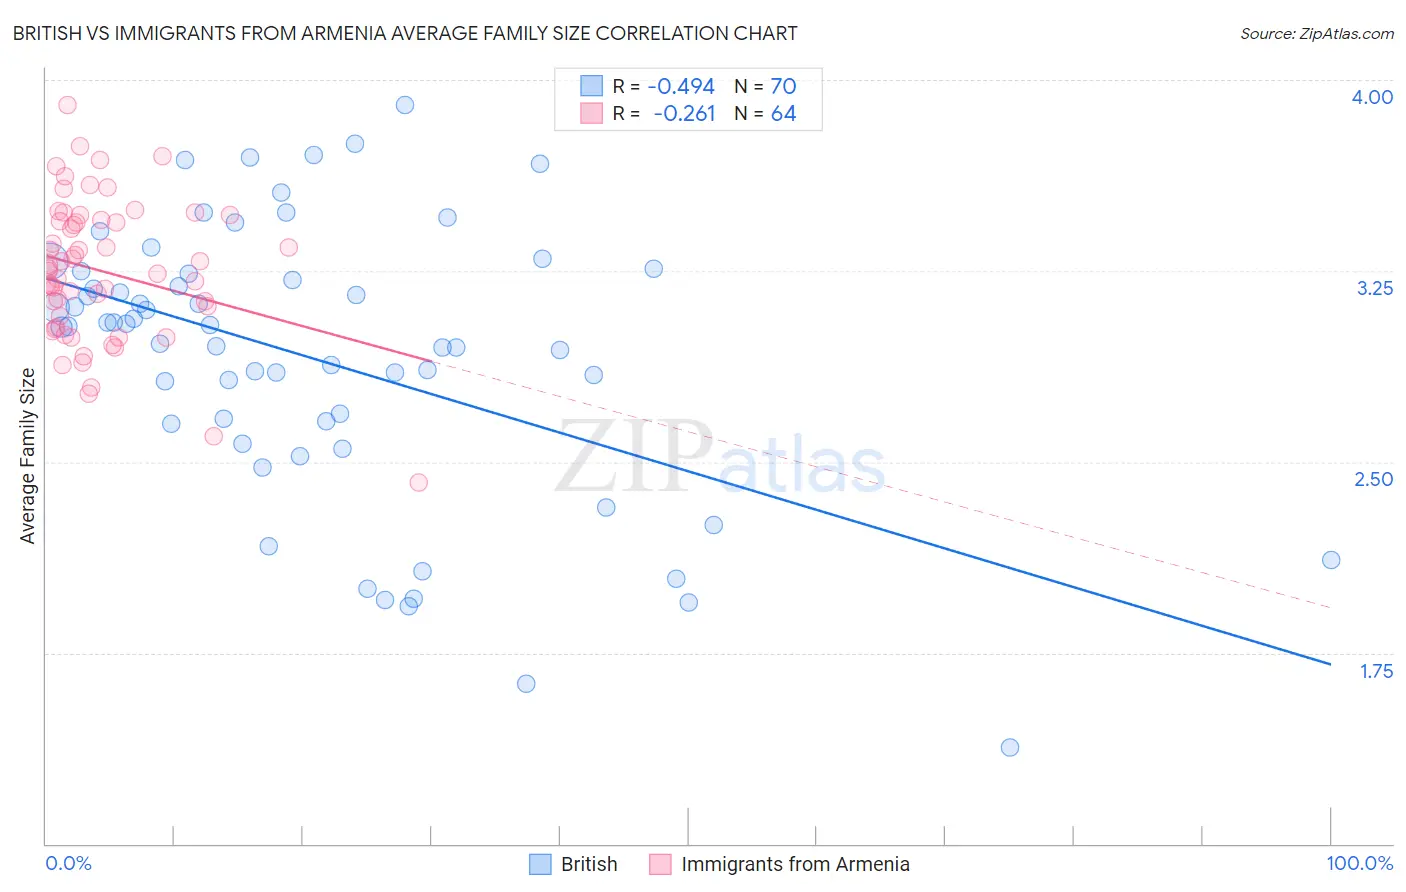
British vs Immigrants from Armenia Average Family Size Correlation Chart
The statistical analysis conducted on geographies consisting of 531,009,581 people shows a moderate negative correlation between the proportion of British and average family size in the United States with a correlation coefficient (R) of -0.494 and weighted average of 3.13. Similarly, the statistical analysis conducted on geographies consisting of 97,714,180 people shows a weak negative correlation between the proportion of Immigrants from Armenia and average family size in the United States with a correlation coefficient (R) of -0.261 and weighted average of 3.35, a difference of 6.8%.
Average Family Size Correlation Summary
| Measurement | British | Immigrants from Armenia |
| Minimum | 1.38 | 2.42 |
| Maximum | 3.90 | 3.90 |
| Range | 2.52 | 1.48 |
| Mean | 2.90 | 3.25 |
| Median | 3.03 | 3.25 |
| Interquartile 25% (IQ1) | 2.65 | 3.05 |
| Interquartile 75% (IQ3) | 3.24 | 3.45 |
| Interquartile Range (IQR) | 0.59 | 0.40 |
| Standard Deviation (Sample) | 0.54 | 0.28 |
| Standard Deviation (Population) | 0.54 | 0.28 |
Similar Demographics by Average Family Size
Demographics Similar to British by Average Family Size
In terms of average family size, the demographic groups most similar to British are Macedonian (3.13, a difference of 0.010%), Immigrants from Latvia (3.13, a difference of 0.010%), Immigrants from Switzerland (3.13, a difference of 0.020%), Australian (3.13, a difference of 0.050%), and Immigrants from Sweden (3.14, a difference of 0.080%).
| Demographics | Rating | Rank | Average Family Size |
| Ukrainians | 0.2 /100 | #296 | Tragic 3.14 |
| Immigrants | Western Europe | 0.2 /100 | #297 | Tragic 3.14 |
| Colville | 0.2 /100 | #298 | Tragic 3.14 |
| Canadians | 0.2 /100 | #299 | Tragic 3.14 |
| Immigrants | Sweden | 0.2 /100 | #300 | Tragic 3.14 |
| Macedonians | 0.2 /100 | #301 | Tragic 3.13 |
| Immigrants | Latvia | 0.2 /100 | #302 | Tragic 3.13 |
| British | 0.2 /100 | #303 | Tragic 3.13 |
| Immigrants | Switzerland | 0.2 /100 | #304 | Tragic 3.13 |
| Australians | 0.1 /100 | #305 | Tragic 3.13 |
| Immigrants | Ireland | 0.1 /100 | #306 | Tragic 3.13 |
| Immigrants | Serbia | 0.1 /100 | #307 | Tragic 3.13 |
| Slavs | 0.1 /100 | #308 | Tragic 3.13 |
| Northern Europeans | 0.1 /100 | #309 | Tragic 3.13 |
| Czechoslovakians | 0.1 /100 | #310 | Tragic 3.13 |
Demographics Similar to Immigrants from Armenia by Average Family Size
In terms of average family size, the demographic groups most similar to Immigrants from Armenia are Japanese (3.35, a difference of 0.020%), Central American Indian (3.35, a difference of 0.030%), Honduran (3.35, a difference of 0.11%), Sri Lankan (3.35, a difference of 0.12%), and Immigrants from Dominican Republic (3.35, a difference of 0.18%).
| Demographics | Rating | Rank | Average Family Size |
| Koreans | 100.0 /100 | #53 | Exceptional 3.36 |
| Immigrants | South Eastern Asia | 100.0 /100 | #54 | Exceptional 3.36 |
| Immigrants | Honduras | 100.0 /100 | #55 | Exceptional 3.36 |
| Immigrants | Dominican Republic | 100.0 /100 | #56 | Exceptional 3.35 |
| Sri Lankans | 100.0 /100 | #57 | Exceptional 3.35 |
| Hondurans | 100.0 /100 | #58 | Exceptional 3.35 |
| Japanese | 100.0 /100 | #59 | Exceptional 3.35 |
| Immigrants | Armenia | 100.0 /100 | #60 | Exceptional 3.35 |
| Central American Indians | 100.0 /100 | #61 | Exceptional 3.35 |
| Immigrants | Grenada | 100.0 /100 | #62 | Exceptional 3.34 |
| Chinese | 100.0 /100 | #63 | Exceptional 3.34 |
| Dominicans | 99.9 /100 | #64 | Exceptional 3.34 |
| Immigrants | Laos | 99.9 /100 | #65 | Exceptional 3.34 |
| Immigrants | St. Vincent and the Grenadines | 99.9 /100 | #66 | Exceptional 3.34 |
| Immigrants | Jamaica | 99.9 /100 | #67 | Exceptional 3.33 |