British vs Barbadian Average Family Size
COMPARE
British
Barbadian
Average Family Size
Average Family Size Comparison
British
Barbadians
3.13
AVERAGE FAMILY SIZE
0.2/ 100
METRIC RATING
303rd/ 347
METRIC RANK
3.29
AVERAGE FAMILY SIZE
98.6/ 100
METRIC RATING
98th/ 347
METRIC RANK
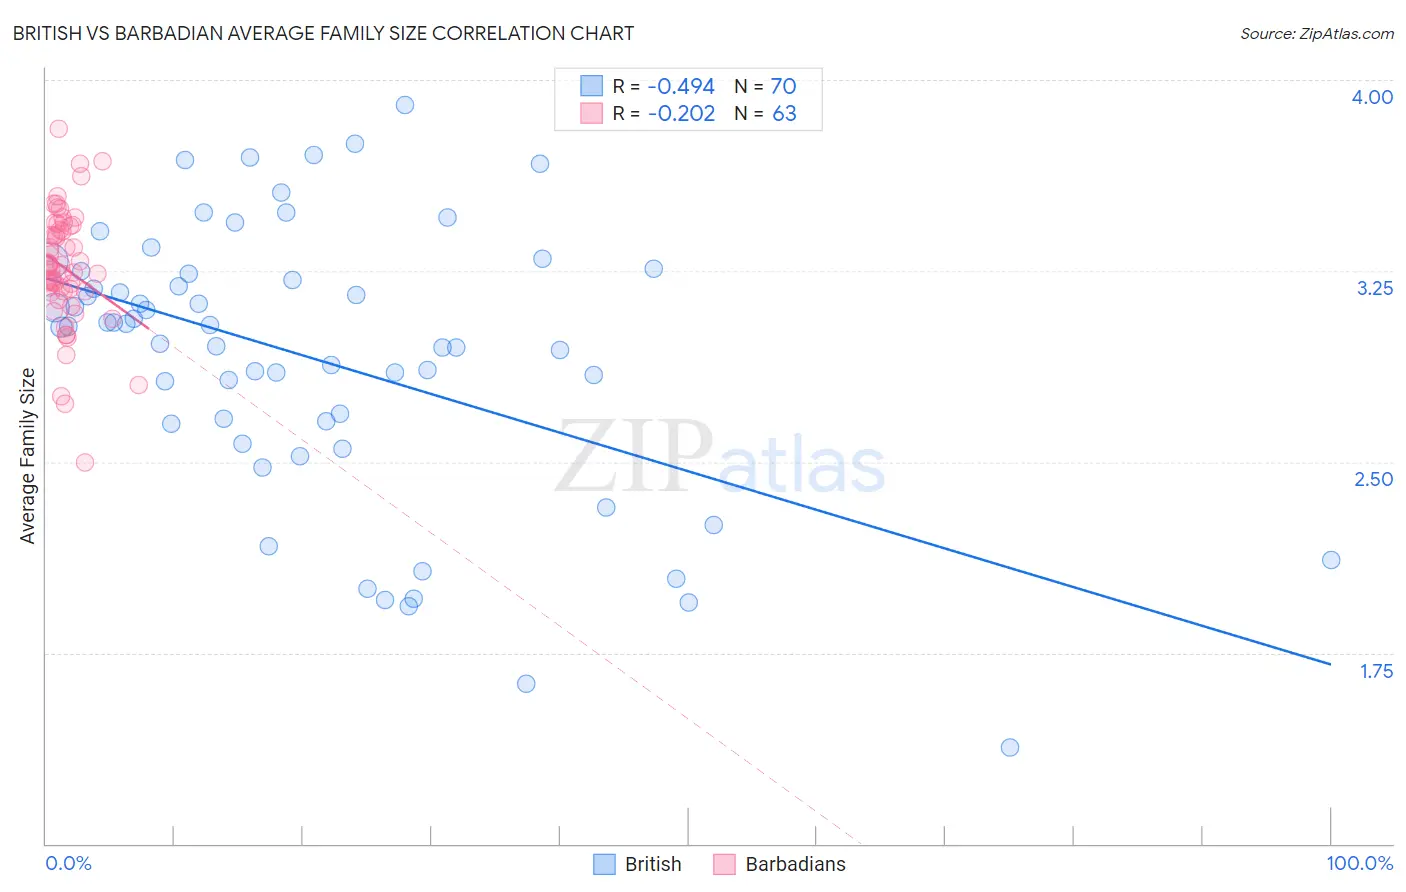
British vs Barbadian Average Family Size Correlation Chart
The statistical analysis conducted on geographies consisting of 531,009,581 people shows a moderate negative correlation between the proportion of British and average family size in the United States with a correlation coefficient (R) of -0.494 and weighted average of 3.13. Similarly, the statistical analysis conducted on geographies consisting of 141,251,330 people shows a weak negative correlation between the proportion of Barbadians and average family size in the United States with a correlation coefficient (R) of -0.202 and weighted average of 3.29, a difference of 5.0%.
Average Family Size Correlation Summary
| Measurement | British | Barbadian |
| Minimum | 1.38 | 2.50 |
| Maximum | 3.90 | 3.81 |
| Range | 2.52 | 1.31 |
| Mean | 2.90 | 3.26 |
| Median | 3.03 | 3.27 |
| Interquartile 25% (IQ1) | 2.65 | 3.17 |
| Interquartile 75% (IQ3) | 3.24 | 3.43 |
| Interquartile Range (IQR) | 0.59 | 0.26 |
| Standard Deviation (Sample) | 0.54 | 0.23 |
| Standard Deviation (Population) | 0.54 | 0.23 |
Similar Demographics by Average Family Size
Demographics Similar to British by Average Family Size
In terms of average family size, the demographic groups most similar to British are Macedonian (3.13, a difference of 0.010%), Immigrants from Latvia (3.13, a difference of 0.010%), Immigrants from Switzerland (3.13, a difference of 0.020%), Australian (3.13, a difference of 0.050%), and Immigrants from Sweden (3.14, a difference of 0.080%).
| Demographics | Rating | Rank | Average Family Size |
| Ukrainians | 0.2 /100 | #296 | Tragic 3.14 |
| Immigrants | Western Europe | 0.2 /100 | #297 | Tragic 3.14 |
| Colville | 0.2 /100 | #298 | Tragic 3.14 |
| Canadians | 0.2 /100 | #299 | Tragic 3.14 |
| Immigrants | Sweden | 0.2 /100 | #300 | Tragic 3.14 |
| Macedonians | 0.2 /100 | #301 | Tragic 3.13 |
| Immigrants | Latvia | 0.2 /100 | #302 | Tragic 3.13 |
| British | 0.2 /100 | #303 | Tragic 3.13 |
| Immigrants | Switzerland | 0.2 /100 | #304 | Tragic 3.13 |
| Australians | 0.1 /100 | #305 | Tragic 3.13 |
| Immigrants | Ireland | 0.1 /100 | #306 | Tragic 3.13 |
| Immigrants | Serbia | 0.1 /100 | #307 | Tragic 3.13 |
| Slavs | 0.1 /100 | #308 | Tragic 3.13 |
| Northern Europeans | 0.1 /100 | #309 | Tragic 3.13 |
| Czechoslovakians | 0.1 /100 | #310 | Tragic 3.13 |
Demographics Similar to Barbadians by Average Family Size
In terms of average family size, the demographic groups most similar to Barbadians are Immigrants from Oceania (3.29, a difference of 0.0%), Nigerian (3.29, a difference of 0.0%), Guamanian/Chamorro (3.29, a difference of 0.010%), Immigrants from Burma/Myanmar (3.29, a difference of 0.030%), and West Indian (3.29, a difference of 0.030%).
| Demographics | Rating | Rank | Average Family Size |
| Immigrants | Pakistan | 99.2 /100 | #91 | Exceptional 3.30 |
| Immigrants | Cameroon | 99.2 /100 | #92 | Exceptional 3.30 |
| Peruvians | 99.2 /100 | #93 | Exceptional 3.30 |
| Sierra Leoneans | 99.0 /100 | #94 | Exceptional 3.30 |
| Immigrants | Lebanon | 99.0 /100 | #95 | Exceptional 3.30 |
| U.S. Virgin Islanders | 98.8 /100 | #96 | Exceptional 3.29 |
| Immigrants | Oceania | 98.7 /100 | #97 | Exceptional 3.29 |
| Barbadians | 98.6 /100 | #98 | Exceptional 3.29 |
| Nigerians | 98.6 /100 | #99 | Exceptional 3.29 |
| Guamanians/Chamorros | 98.6 /100 | #100 | Exceptional 3.29 |
| Immigrants | Burma/Myanmar | 98.6 /100 | #101 | Exceptional 3.29 |
| West Indians | 98.5 /100 | #102 | Exceptional 3.29 |
| Immigrants | Western Africa | 98.4 /100 | #103 | Exceptional 3.29 |
| Bolivians | 98.3 /100 | #104 | Exceptional 3.29 |
| Immigrants | Ghana | 98.1 /100 | #105 | Exceptional 3.29 |