Finnish vs Immigrants from Zimbabwe Average Family Size
COMPARE
Finnish
Immigrants from Zimbabwe
Average Family Size
Average Family Size Comparison
Finns
Immigrants from Zimbabwe
3.09
AVERAGE FAMILY SIZE
0.0/ 100
METRIC RATING
340th/ 347
METRIC RANK
3.19
AVERAGE FAMILY SIZE
7.1/ 100
METRIC RATING
223rd/ 347
METRIC RANK
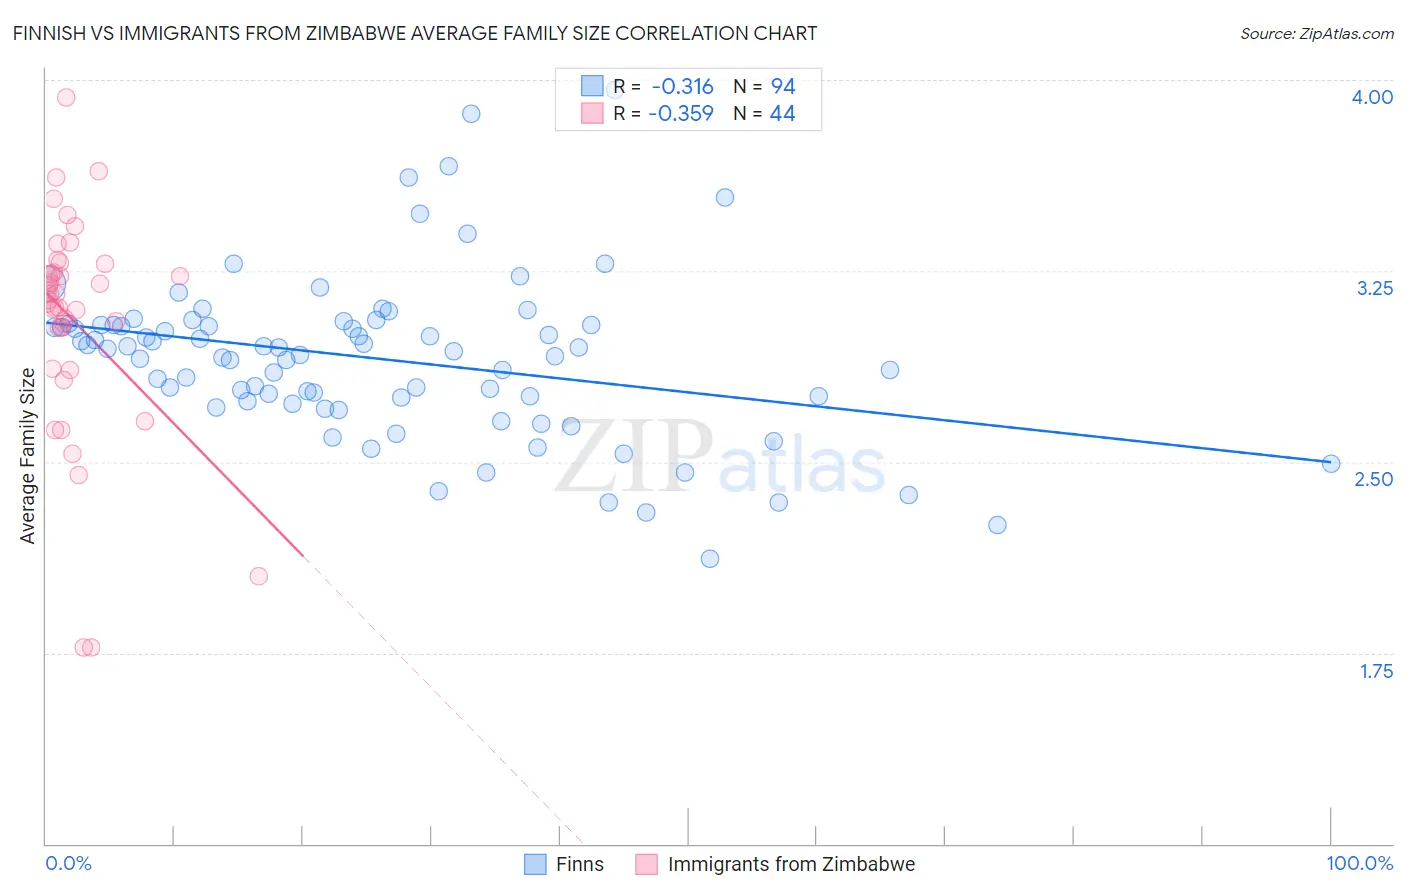
Finnish vs Immigrants from Zimbabwe Average Family Size Correlation Chart
The statistical analysis conducted on geographies consisting of 404,508,275 people shows a mild negative correlation between the proportion of Finns and average family size in the United States with a correlation coefficient (R) of -0.316 and weighted average of 3.09. Similarly, the statistical analysis conducted on geographies consisting of 117,791,116 people shows a mild negative correlation between the proportion of Immigrants from Zimbabwe and average family size in the United States with a correlation coefficient (R) of -0.359 and weighted average of 3.19, a difference of 3.1%.
Average Family Size Correlation Summary
| Measurement | Finnish | Immigrants from Zimbabwe |
| Minimum | 2.12 | 1.77 |
| Maximum | 3.96 | 3.93 |
| Range | 1.84 | 2.16 |
| Mean | 2.90 | 3.05 |
| Median | 2.94 | 3.15 |
| Interquartile 25% (IQ1) | 2.74 | 2.95 |
| Interquartile 75% (IQ3) | 3.04 | 3.26 |
| Interquartile Range (IQR) | 0.30 | 0.31 |
| Standard Deviation (Sample) | 0.32 | 0.44 |
| Standard Deviation (Population) | 0.32 | 0.43 |
Similar Demographics by Average Family Size
Demographics Similar to Finns by Average Family Size
In terms of average family size, the demographic groups most similar to Finns are Polish (3.09, a difference of 0.050%), Croatian (3.10, a difference of 0.14%), French (3.10, a difference of 0.16%), Swedish (3.10, a difference of 0.18%), and German (3.09, a difference of 0.19%).
| Demographics | Rating | Rank | Average Family Size |
| Estonians | 0.0 /100 | #333 | Tragic 3.10 |
| Lithuanians | 0.0 /100 | #334 | Tragic 3.10 |
| Luxembourgers | 0.0 /100 | #335 | Tragic 3.10 |
| Irish | 0.0 /100 | #336 | Tragic 3.10 |
| Swedes | 0.0 /100 | #337 | Tragic 3.10 |
| French | 0.0 /100 | #338 | Tragic 3.10 |
| Croatians | 0.0 /100 | #339 | Tragic 3.10 |
| Finns | 0.0 /100 | #340 | Tragic 3.09 |
| Poles | 0.0 /100 | #341 | Tragic 3.09 |
| Germans | 0.0 /100 | #342 | Tragic 3.09 |
| Norwegians | 0.0 /100 | #343 | Tragic 3.08 |
| French Canadians | 0.0 /100 | #344 | Tragic 3.07 |
| Slovenes | 0.0 /100 | #345 | Tragic 3.07 |
| Slovaks | 0.0 /100 | #346 | Tragic 3.06 |
| Carpatho Rusyns | 0.0 /100 | #347 | Tragic 3.06 |
Demographics Similar to Immigrants from Zimbabwe by Average Family Size
In terms of average family size, the demographic groups most similar to Immigrants from Zimbabwe are Immigrants from Ukraine (3.19, a difference of 0.010%), Immigrants from Kuwait (3.19, a difference of 0.010%), Syrian (3.19, a difference of 0.040%), Cree (3.19, a difference of 0.060%), and Chickasaw (3.19, a difference of 0.080%).
| Demographics | Rating | Rank | Average Family Size |
| Bermudans | 11.0 /100 | #216 | Poor 3.20 |
| Immigrants | Somalia | 10.3 /100 | #217 | Poor 3.20 |
| French American Indians | 9.8 /100 | #218 | Tragic 3.20 |
| Pennsylvania Germans | 9.3 /100 | #219 | Tragic 3.19 |
| Lebanese | 9.1 /100 | #220 | Tragic 3.19 |
| Immigrants | Ukraine | 7.2 /100 | #221 | Tragic 3.19 |
| Immigrants | Kuwait | 7.2 /100 | #222 | Tragic 3.19 |
| Immigrants | Zimbabwe | 7.1 /100 | #223 | Tragic 3.19 |
| Syrians | 6.5 /100 | #224 | Tragic 3.19 |
| Cree | 6.2 /100 | #225 | Tragic 3.19 |
| Chickasaw | 6.0 /100 | #226 | Tragic 3.19 |
| Portuguese | 6.0 /100 | #227 | Tragic 3.19 |
| Immigrants | Nonimmigrants | 5.7 /100 | #228 | Tragic 3.19 |
| Immigrants | Italy | 5.3 /100 | #229 | Tragic 3.19 |
| Icelanders | 5.2 /100 | #230 | Tragic 3.19 |