British vs Burmese Average Family Size
COMPARE
British
Burmese
Average Family Size
Average Family Size Comparison
British
Burmese
3.13
AVERAGE FAMILY SIZE
0.2/ 100
METRIC RATING
303rd/ 347
METRIC RANK
3.22
AVERAGE FAMILY SIZE
31.0/ 100
METRIC RATING
190th/ 347
METRIC RANK
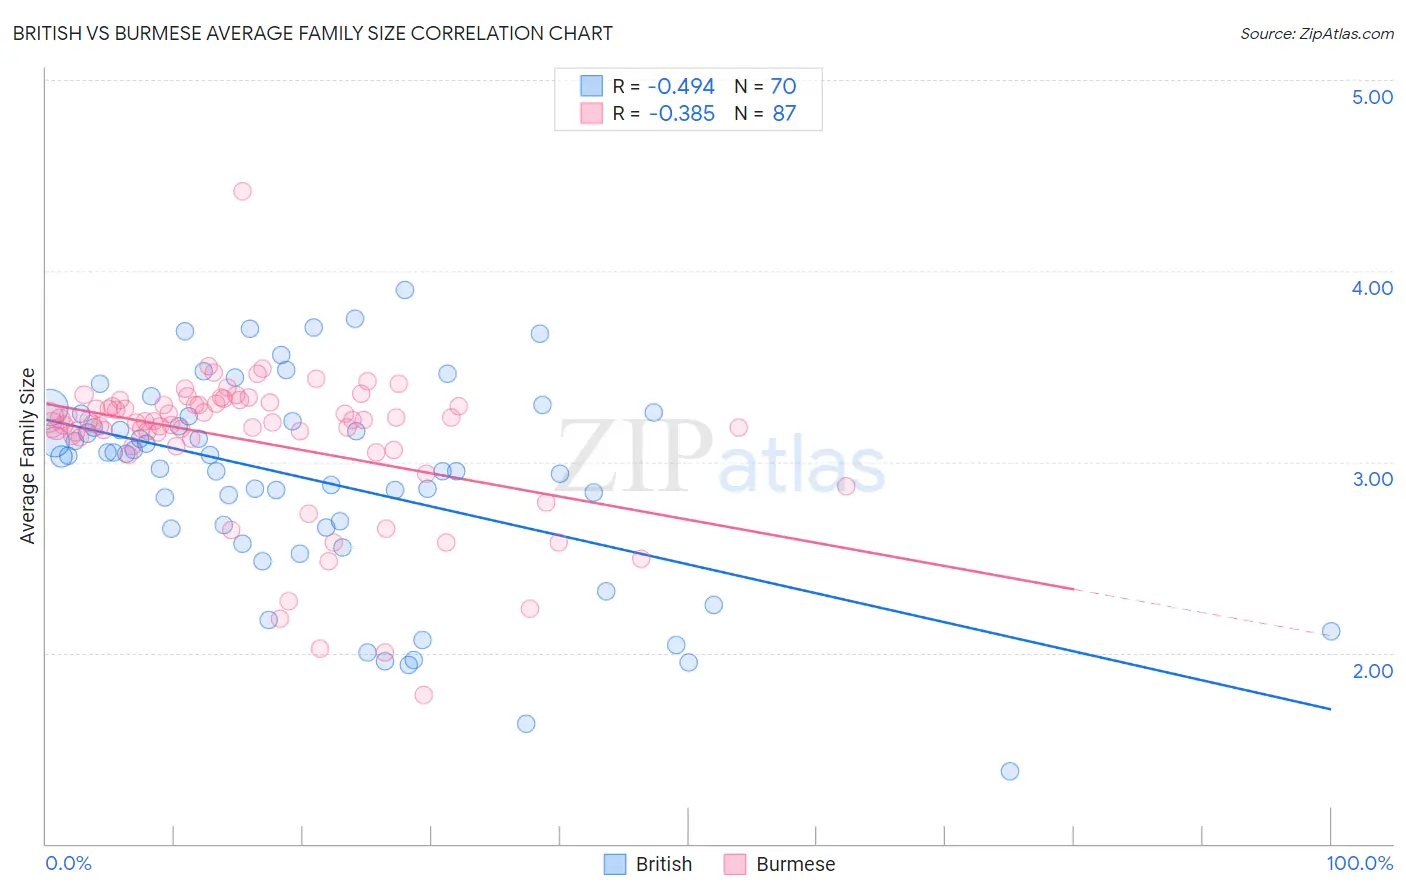
British vs Burmese Average Family Size Correlation Chart
The statistical analysis conducted on geographies consisting of 531,009,581 people shows a moderate negative correlation between the proportion of British and average family size in the United States with a correlation coefficient (R) of -0.494 and weighted average of 3.13. Similarly, the statistical analysis conducted on geographies consisting of 464,897,225 people shows a mild negative correlation between the proportion of Burmese and average family size in the United States with a correlation coefficient (R) of -0.385 and weighted average of 3.22, a difference of 2.6%.
Average Family Size Correlation Summary
| Measurement | British | Burmese |
| Minimum | 1.38 | 1.78 |
| Maximum | 3.90 | 4.42 |
| Range | 2.52 | 2.64 |
| Mean | 2.90 | 3.11 |
| Median | 3.03 | 3.21 |
| Interquartile 25% (IQ1) | 2.65 | 3.08 |
| Interquartile 75% (IQ3) | 3.24 | 3.30 |
| Interquartile Range (IQR) | 0.59 | 0.22 |
| Standard Deviation (Sample) | 0.54 | 0.39 |
| Standard Deviation (Population) | 0.54 | 0.38 |
Similar Demographics by Average Family Size
Demographics Similar to British by Average Family Size
In terms of average family size, the demographic groups most similar to British are Macedonian (3.13, a difference of 0.010%), Immigrants from Latvia (3.13, a difference of 0.010%), Immigrants from Switzerland (3.13, a difference of 0.020%), Australian (3.13, a difference of 0.050%), and Immigrants from Sweden (3.14, a difference of 0.080%).
| Demographics | Rating | Rank | Average Family Size |
| Ukrainians | 0.2 /100 | #296 | Tragic 3.14 |
| Immigrants | Western Europe | 0.2 /100 | #297 | Tragic 3.14 |
| Colville | 0.2 /100 | #298 | Tragic 3.14 |
| Canadians | 0.2 /100 | #299 | Tragic 3.14 |
| Immigrants | Sweden | 0.2 /100 | #300 | Tragic 3.14 |
| Macedonians | 0.2 /100 | #301 | Tragic 3.13 |
| Immigrants | Latvia | 0.2 /100 | #302 | Tragic 3.13 |
| British | 0.2 /100 | #303 | Tragic 3.13 |
| Immigrants | Switzerland | 0.2 /100 | #304 | Tragic 3.13 |
| Australians | 0.1 /100 | #305 | Tragic 3.13 |
| Immigrants | Ireland | 0.1 /100 | #306 | Tragic 3.13 |
| Immigrants | Serbia | 0.1 /100 | #307 | Tragic 3.13 |
| Slavs | 0.1 /100 | #308 | Tragic 3.13 |
| Northern Europeans | 0.1 /100 | #309 | Tragic 3.13 |
| Czechoslovakians | 0.1 /100 | #310 | Tragic 3.13 |
Demographics Similar to Burmese by Average Family Size
In terms of average family size, the demographic groups most similar to Burmese are Immigrants from Zaire (3.22, a difference of 0.010%), Immigrants from Eastern Africa (3.22, a difference of 0.020%), Immigrants from Israel (3.22, a difference of 0.040%), Immigrants from Sudan (3.22, a difference of 0.040%), and Pakistani (3.22, a difference of 0.060%).
| Demographics | Rating | Rank | Average Family Size |
| Immigrants | Northern Africa | 41.7 /100 | #183 | Average 3.22 |
| Immigrants | Eastern Asia | 40.8 /100 | #184 | Average 3.22 |
| Immigrants | Sri Lanka | 39.8 /100 | #185 | Fair 3.22 |
| Immigrants | Argentina | 39.8 /100 | #186 | Fair 3.22 |
| Immigrants | Malaysia | 39.0 /100 | #187 | Fair 3.22 |
| Thais | 38.3 /100 | #188 | Fair 3.22 |
| Pakistanis | 33.7 /100 | #189 | Fair 3.22 |
| Burmese | 31.0 /100 | #190 | Fair 3.22 |
| Immigrants | Zaire | 30.5 /100 | #191 | Fair 3.22 |
| Immigrants | Eastern Africa | 30.1 /100 | #192 | Fair 3.22 |
| Immigrants | Israel | 29.3 /100 | #193 | Fair 3.22 |
| Immigrants | Sudan | 29.1 /100 | #194 | Fair 3.22 |
| Choctaw | 28.3 /100 | #195 | Fair 3.21 |
| Senegalese | 28.2 /100 | #196 | Fair 3.21 |
| Kenyans | 28.0 /100 | #197 | Fair 3.21 |