British vs Immigrants from Kenya Average Family Size
COMPARE
British
Immigrants from Kenya
Average Family Size
Average Family Size Comparison
British
Immigrants from Kenya
3.13
AVERAGE FAMILY SIZE
0.2/ 100
METRIC RATING
303rd/ 347
METRIC RANK
3.21
AVERAGE FAMILY SIZE
19.2/ 100
METRIC RATING
200th/ 347
METRIC RANK
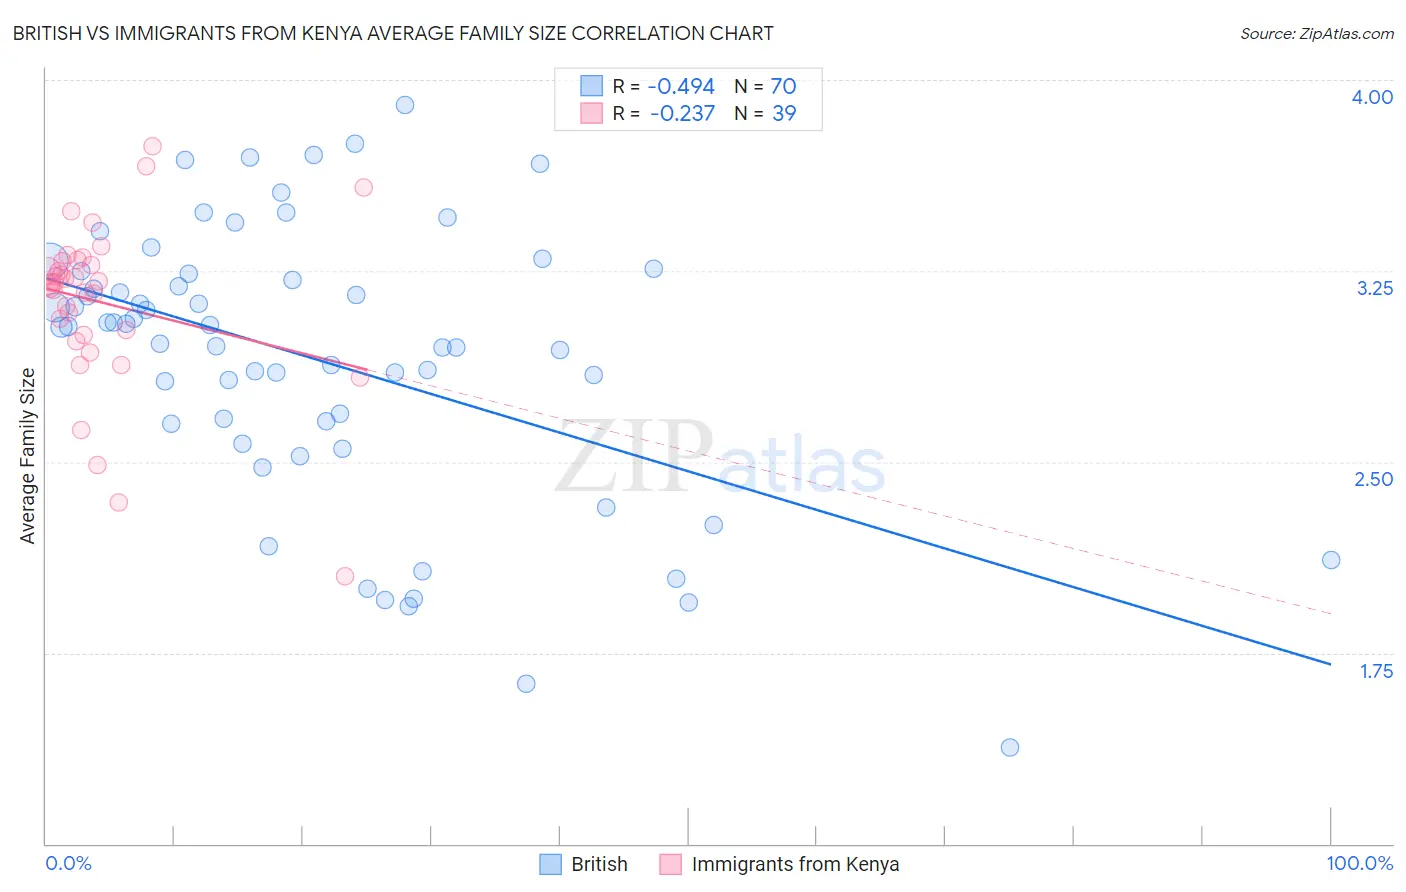
British vs Immigrants from Kenya Average Family Size Correlation Chart
The statistical analysis conducted on geographies consisting of 531,009,581 people shows a moderate negative correlation between the proportion of British and average family size in the United States with a correlation coefficient (R) of -0.494 and weighted average of 3.13. Similarly, the statistical analysis conducted on geographies consisting of 217,999,239 people shows a weak negative correlation between the proportion of Immigrants from Kenya and average family size in the United States with a correlation coefficient (R) of -0.237 and weighted average of 3.21, a difference of 2.3%.
Average Family Size Correlation Summary
| Measurement | British | Immigrants from Kenya |
| Minimum | 1.38 | 2.05 |
| Maximum | 3.90 | 3.74 |
| Range | 2.52 | 1.69 |
| Mean | 2.90 | 3.13 |
| Median | 3.03 | 3.21 |
| Interquartile 25% (IQ1) | 2.65 | 3.00 |
| Interquartile 75% (IQ3) | 3.24 | 3.29 |
| Interquartile Range (IQR) | 0.59 | 0.29 |
| Standard Deviation (Sample) | 0.54 | 0.33 |
| Standard Deviation (Population) | 0.54 | 0.33 |
Similar Demographics by Average Family Size
Demographics Similar to British by Average Family Size
In terms of average family size, the demographic groups most similar to British are Macedonian (3.13, a difference of 0.010%), Immigrants from Latvia (3.13, a difference of 0.010%), Immigrants from Switzerland (3.13, a difference of 0.020%), Australian (3.13, a difference of 0.050%), and Immigrants from Sweden (3.14, a difference of 0.080%).
| Demographics | Rating | Rank | Average Family Size |
| Ukrainians | 0.2 /100 | #296 | Tragic 3.14 |
| Immigrants | Western Europe | 0.2 /100 | #297 | Tragic 3.14 |
| Colville | 0.2 /100 | #298 | Tragic 3.14 |
| Canadians | 0.2 /100 | #299 | Tragic 3.14 |
| Immigrants | Sweden | 0.2 /100 | #300 | Tragic 3.14 |
| Macedonians | 0.2 /100 | #301 | Tragic 3.13 |
| Immigrants | Latvia | 0.2 /100 | #302 | Tragic 3.13 |
| British | 0.2 /100 | #303 | Tragic 3.13 |
| Immigrants | Switzerland | 0.2 /100 | #304 | Tragic 3.13 |
| Australians | 0.1 /100 | #305 | Tragic 3.13 |
| Immigrants | Ireland | 0.1 /100 | #306 | Tragic 3.13 |
| Immigrants | Serbia | 0.1 /100 | #307 | Tragic 3.13 |
| Slavs | 0.1 /100 | #308 | Tragic 3.13 |
| Northern Europeans | 0.1 /100 | #309 | Tragic 3.13 |
| Czechoslovakians | 0.1 /100 | #310 | Tragic 3.13 |
Demographics Similar to Immigrants from Kenya by Average Family Size
In terms of average family size, the demographic groups most similar to Immigrants from Kenya are Immigrants from Morocco (3.21, a difference of 0.020%), Immigrants from India (3.21, a difference of 0.020%), Immigrants from Nepal (3.21, a difference of 0.030%), Hmong (3.21, a difference of 0.040%), and Immigrants from the Azores (3.21, a difference of 0.070%).
| Demographics | Rating | Rank | Average Family Size |
| Immigrants | Israel | 29.3 /100 | #193 | Fair 3.22 |
| Immigrants | Sudan | 29.1 /100 | #194 | Fair 3.22 |
| Choctaw | 28.3 /100 | #195 | Fair 3.21 |
| Senegalese | 28.2 /100 | #196 | Fair 3.21 |
| Kenyans | 28.0 /100 | #197 | Fair 3.21 |
| Immigrants | Azores | 21.7 /100 | #198 | Fair 3.21 |
| Hmong | 20.7 /100 | #199 | Fair 3.21 |
| Immigrants | Kenya | 19.2 /100 | #200 | Poor 3.21 |
| Immigrants | Morocco | 18.5 /100 | #201 | Poor 3.21 |
| Immigrants | India | 18.5 /100 | #202 | Poor 3.21 |
| Immigrants | Nepal | 18.1 /100 | #203 | Poor 3.21 |
| Immigrants | Poland | 16.6 /100 | #204 | Poor 3.20 |
| Paraguayans | 16.3 /100 | #205 | Poor 3.20 |
| Immigrants | Cabo Verde | 16.0 /100 | #206 | Poor 3.20 |
| Filipinos | 13.6 /100 | #207 | Poor 3.20 |