British vs Belizean Average Family Size
COMPARE
British
Belizean
Average Family Size
Average Family Size Comparison
British
Belizeans
3.13
AVERAGE FAMILY SIZE
0.2/ 100
METRIC RATING
303rd/ 347
METRIC RANK
3.39
AVERAGE FAMILY SIZE
100.0/ 100
METRIC RATING
40th/ 347
METRIC RANK
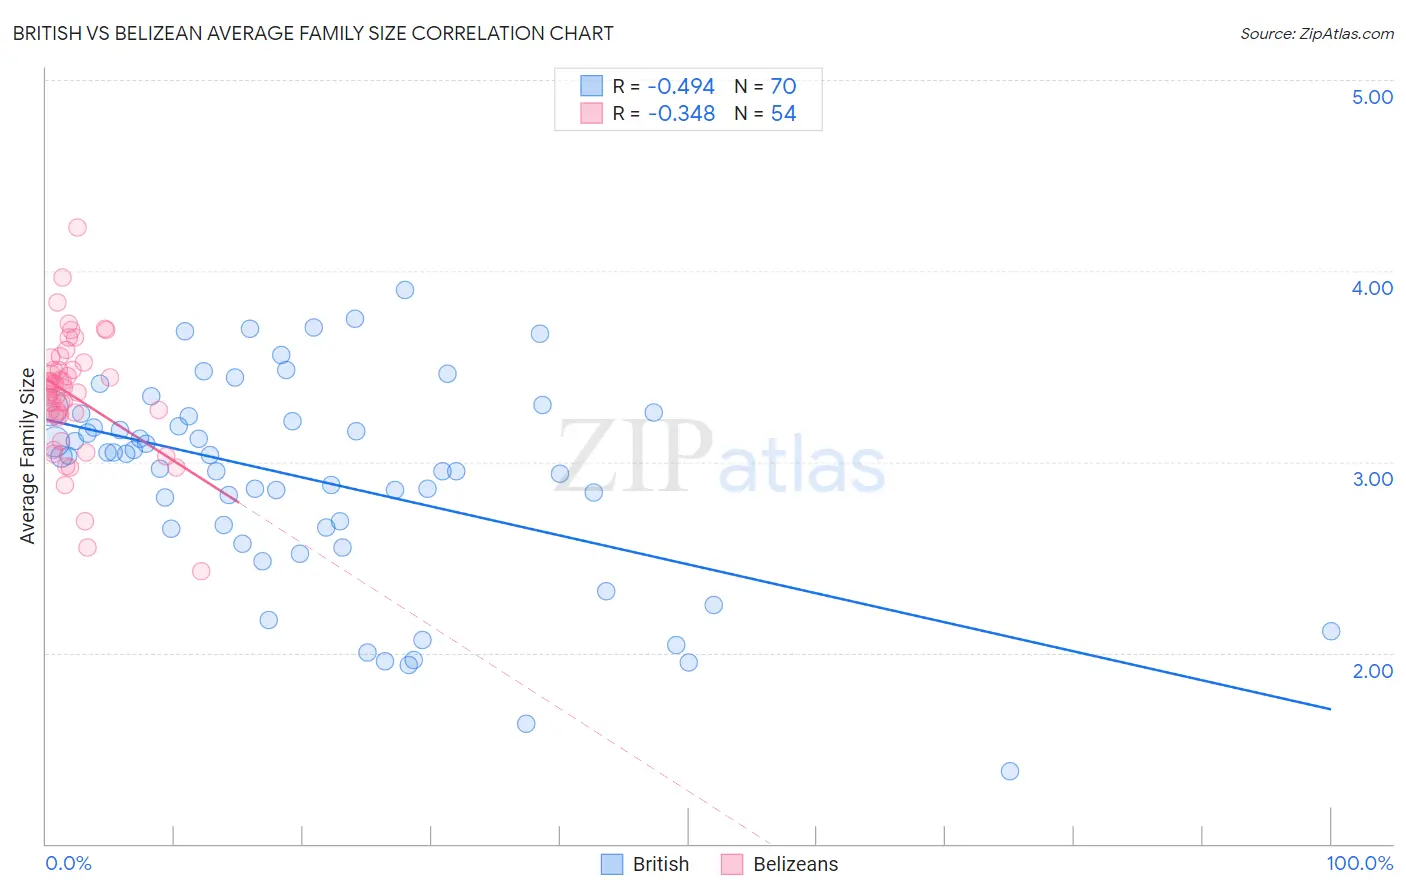
British vs Belizean Average Family Size Correlation Chart
The statistical analysis conducted on geographies consisting of 531,009,581 people shows a moderate negative correlation between the proportion of British and average family size in the United States with a correlation coefficient (R) of -0.494 and weighted average of 3.13. Similarly, the statistical analysis conducted on geographies consisting of 144,152,249 people shows a mild negative correlation between the proportion of Belizeans and average family size in the United States with a correlation coefficient (R) of -0.348 and weighted average of 3.39, a difference of 8.1%.
Average Family Size Correlation Summary
| Measurement | British | Belizean |
| Minimum | 1.38 | 2.43 |
| Maximum | 3.90 | 4.23 |
| Range | 2.52 | 1.80 |
| Mean | 2.90 | 3.34 |
| Median | 3.03 | 3.37 |
| Interquartile 25% (IQ1) | 2.65 | 3.24 |
| Interquartile 75% (IQ3) | 3.24 | 3.48 |
| Interquartile Range (IQR) | 0.59 | 0.24 |
| Standard Deviation (Sample) | 0.54 | 0.32 |
| Standard Deviation (Population) | 0.54 | 0.32 |
Similar Demographics by Average Family Size
Demographics Similar to British by Average Family Size
In terms of average family size, the demographic groups most similar to British are Macedonian (3.13, a difference of 0.010%), Immigrants from Latvia (3.13, a difference of 0.010%), Immigrants from Switzerland (3.13, a difference of 0.020%), Australian (3.13, a difference of 0.050%), and Immigrants from Sweden (3.14, a difference of 0.080%).
| Demographics | Rating | Rank | Average Family Size |
| Ukrainians | 0.2 /100 | #296 | Tragic 3.14 |
| Immigrants | Western Europe | 0.2 /100 | #297 | Tragic 3.14 |
| Colville | 0.2 /100 | #298 | Tragic 3.14 |
| Canadians | 0.2 /100 | #299 | Tragic 3.14 |
| Immigrants | Sweden | 0.2 /100 | #300 | Tragic 3.14 |
| Macedonians | 0.2 /100 | #301 | Tragic 3.13 |
| Immigrants | Latvia | 0.2 /100 | #302 | Tragic 3.13 |
| British | 0.2 /100 | #303 | Tragic 3.13 |
| Immigrants | Switzerland | 0.2 /100 | #304 | Tragic 3.13 |
| Australians | 0.1 /100 | #305 | Tragic 3.13 |
| Immigrants | Ireland | 0.1 /100 | #306 | Tragic 3.13 |
| Immigrants | Serbia | 0.1 /100 | #307 | Tragic 3.13 |
| Slavs | 0.1 /100 | #308 | Tragic 3.13 |
| Northern Europeans | 0.1 /100 | #309 | Tragic 3.13 |
| Czechoslovakians | 0.1 /100 | #310 | Tragic 3.13 |
Demographics Similar to Belizeans by Average Family Size
In terms of average family size, the demographic groups most similar to Belizeans are Immigrants from Haiti (3.39, a difference of 0.12%), Marshallese (3.38, a difference of 0.17%), Immigrants from Belize (3.39, a difference of 0.20%), Immigrants from Vietnam (3.38, a difference of 0.23%), and Immigrants from Philippines (3.37, a difference of 0.33%).
| Demographics | Rating | Rank | Average Family Size |
| Hawaiians | 100.0 /100 | #33 | Exceptional 3.41 |
| Hispanics or Latinos | 100.0 /100 | #34 | Exceptional 3.41 |
| Guatemalans | 100.0 /100 | #35 | Exceptional 3.40 |
| Immigrants | Guyana | 100.0 /100 | #36 | Exceptional 3.40 |
| Guyanese | 100.0 /100 | #37 | Exceptional 3.40 |
| Immigrants | Belize | 100.0 /100 | #38 | Exceptional 3.39 |
| Immigrants | Haiti | 100.0 /100 | #39 | Exceptional 3.39 |
| Belizeans | 100.0 /100 | #40 | Exceptional 3.39 |
| Marshallese | 100.0 /100 | #41 | Exceptional 3.38 |
| Immigrants | Vietnam | 100.0 /100 | #42 | Exceptional 3.38 |
| Immigrants | Philippines | 100.0 /100 | #43 | Exceptional 3.37 |
| Alaska Natives | 100.0 /100 | #44 | Exceptional 3.37 |
| Shoshone | 100.0 /100 | #45 | Exceptional 3.37 |
| Haitians | 100.0 /100 | #46 | Exceptional 3.37 |
| Vietnamese | 100.0 /100 | #47 | Exceptional 3.37 |