African vs Immigrants from Zimbabwe Average Family Size
COMPARE
African
Immigrants from Zimbabwe
Average Family Size
Average Family Size Comparison
Africans
Immigrants from Zimbabwe
3.25
AVERAGE FAMILY SIZE
84.9/ 100
METRIC RATING
134th/ 347
METRIC RANK
3.19
AVERAGE FAMILY SIZE
7.1/ 100
METRIC RATING
223rd/ 347
METRIC RANK
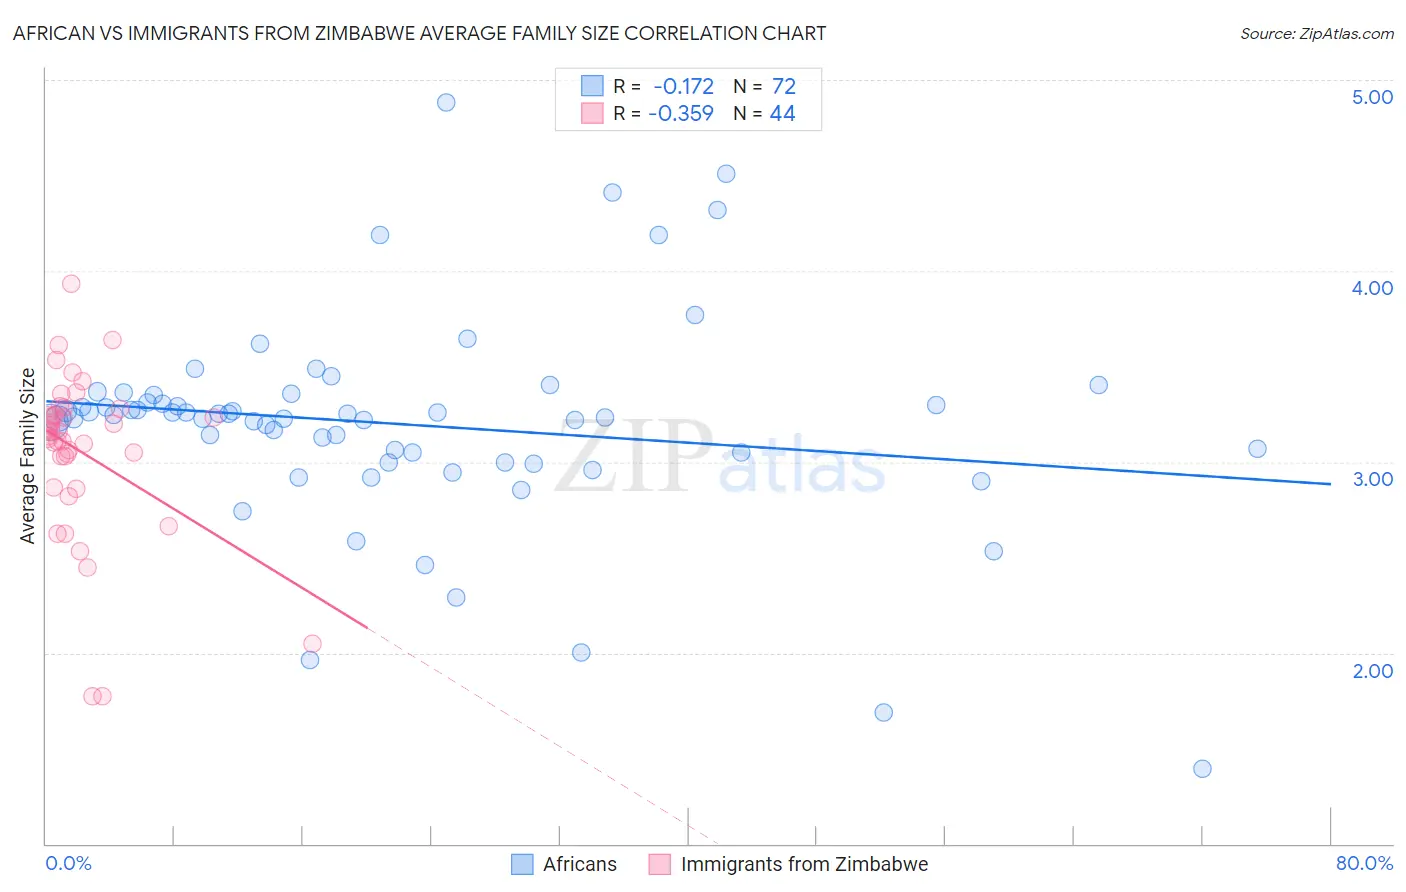
African vs Immigrants from Zimbabwe Average Family Size Correlation Chart
The statistical analysis conducted on geographies consisting of 469,598,302 people shows a poor negative correlation between the proportion of Africans and average family size in the United States with a correlation coefficient (R) of -0.172 and weighted average of 3.25. Similarly, the statistical analysis conducted on geographies consisting of 117,791,116 people shows a mild negative correlation between the proportion of Immigrants from Zimbabwe and average family size in the United States with a correlation coefficient (R) of -0.359 and weighted average of 3.19, a difference of 2.0%.
Average Family Size Correlation Summary
| Measurement | African | Immigrants from Zimbabwe |
| Minimum | 1.39 | 1.77 |
| Maximum | 4.88 | 3.93 |
| Range | 3.49 | 2.16 |
| Mean | 3.20 | 3.05 |
| Median | 3.24 | 3.15 |
| Interquartile 25% (IQ1) | 3.02 | 2.95 |
| Interquartile 75% (IQ3) | 3.33 | 3.26 |
| Interquartile Range (IQR) | 0.31 | 0.31 |
| Standard Deviation (Sample) | 0.56 | 0.44 |
| Standard Deviation (Population) | 0.55 | 0.43 |
Similar Demographics by Average Family Size
Demographics Similar to Africans by Average Family Size
In terms of average family size, the demographic groups most similar to Africans are Panamanian (3.25, a difference of 0.020%), Immigrants from Venezuela (3.26, a difference of 0.050%), Costa Rican (3.26, a difference of 0.070%), Comanche (3.25, a difference of 0.070%), and Immigrants from Middle Africa (3.25, a difference of 0.080%).
| Demographics | Rating | Rank | Average Family Size |
| Immigrants | Syria | 90.6 /100 | #127 | Exceptional 3.26 |
| Colombians | 89.9 /100 | #128 | Excellent 3.26 |
| Immigrants | Hong Kong | 88.6 /100 | #129 | Excellent 3.26 |
| Laotians | 88.5 /100 | #130 | Excellent 3.26 |
| Immigrants | Western Asia | 87.7 /100 | #131 | Excellent 3.26 |
| Costa Ricans | 86.8 /100 | #132 | Excellent 3.26 |
| Immigrants | Venezuela | 86.3 /100 | #133 | Excellent 3.26 |
| Africans | 84.9 /100 | #134 | Excellent 3.25 |
| Panamanians | 84.2 /100 | #135 | Excellent 3.25 |
| Comanche | 82.8 /100 | #136 | Excellent 3.25 |
| Immigrants | Middle Africa | 82.4 /100 | #137 | Excellent 3.25 |
| Cubans | 81.8 /100 | #138 | Excellent 3.25 |
| Immigrants | Ethiopia | 81.6 /100 | #139 | Excellent 3.25 |
| Sub-Saharan Africans | 81.6 /100 | #140 | Excellent 3.25 |
| Venezuelans | 81.4 /100 | #141 | Excellent 3.25 |
Demographics Similar to Immigrants from Zimbabwe by Average Family Size
In terms of average family size, the demographic groups most similar to Immigrants from Zimbabwe are Immigrants from Ukraine (3.19, a difference of 0.010%), Immigrants from Kuwait (3.19, a difference of 0.010%), Syrian (3.19, a difference of 0.040%), Cree (3.19, a difference of 0.060%), and Chickasaw (3.19, a difference of 0.080%).
| Demographics | Rating | Rank | Average Family Size |
| Bermudans | 11.0 /100 | #216 | Poor 3.20 |
| Immigrants | Somalia | 10.3 /100 | #217 | Poor 3.20 |
| French American Indians | 9.8 /100 | #218 | Tragic 3.20 |
| Pennsylvania Germans | 9.3 /100 | #219 | Tragic 3.19 |
| Lebanese | 9.1 /100 | #220 | Tragic 3.19 |
| Immigrants | Ukraine | 7.2 /100 | #221 | Tragic 3.19 |
| Immigrants | Kuwait | 7.2 /100 | #222 | Tragic 3.19 |
| Immigrants | Zimbabwe | 7.1 /100 | #223 | Tragic 3.19 |
| Syrians | 6.5 /100 | #224 | Tragic 3.19 |
| Cree | 6.2 /100 | #225 | Tragic 3.19 |
| Chickasaw | 6.0 /100 | #226 | Tragic 3.19 |
| Portuguese | 6.0 /100 | #227 | Tragic 3.19 |
| Immigrants | Nonimmigrants | 5.7 /100 | #228 | Tragic 3.19 |
| Immigrants | Italy | 5.3 /100 | #229 | Tragic 3.19 |
| Icelanders | 5.2 /100 | #230 | Tragic 3.19 |