British vs Immigrants from Cabo Verde Single Father Households
COMPARE
British
Immigrants from Cabo Verde
Single Father Households
Single Father Households Comparison
British
Immigrants from Cabo Verde
2.2%
SINGLE FATHER HOUSEHOLDS
92.8/ 100
METRIC RATING
140th/ 347
METRIC RANK
3.1%
SINGLE FATHER HOUSEHOLDS
0.0/ 100
METRIC RATING
328th/ 347
METRIC RANK
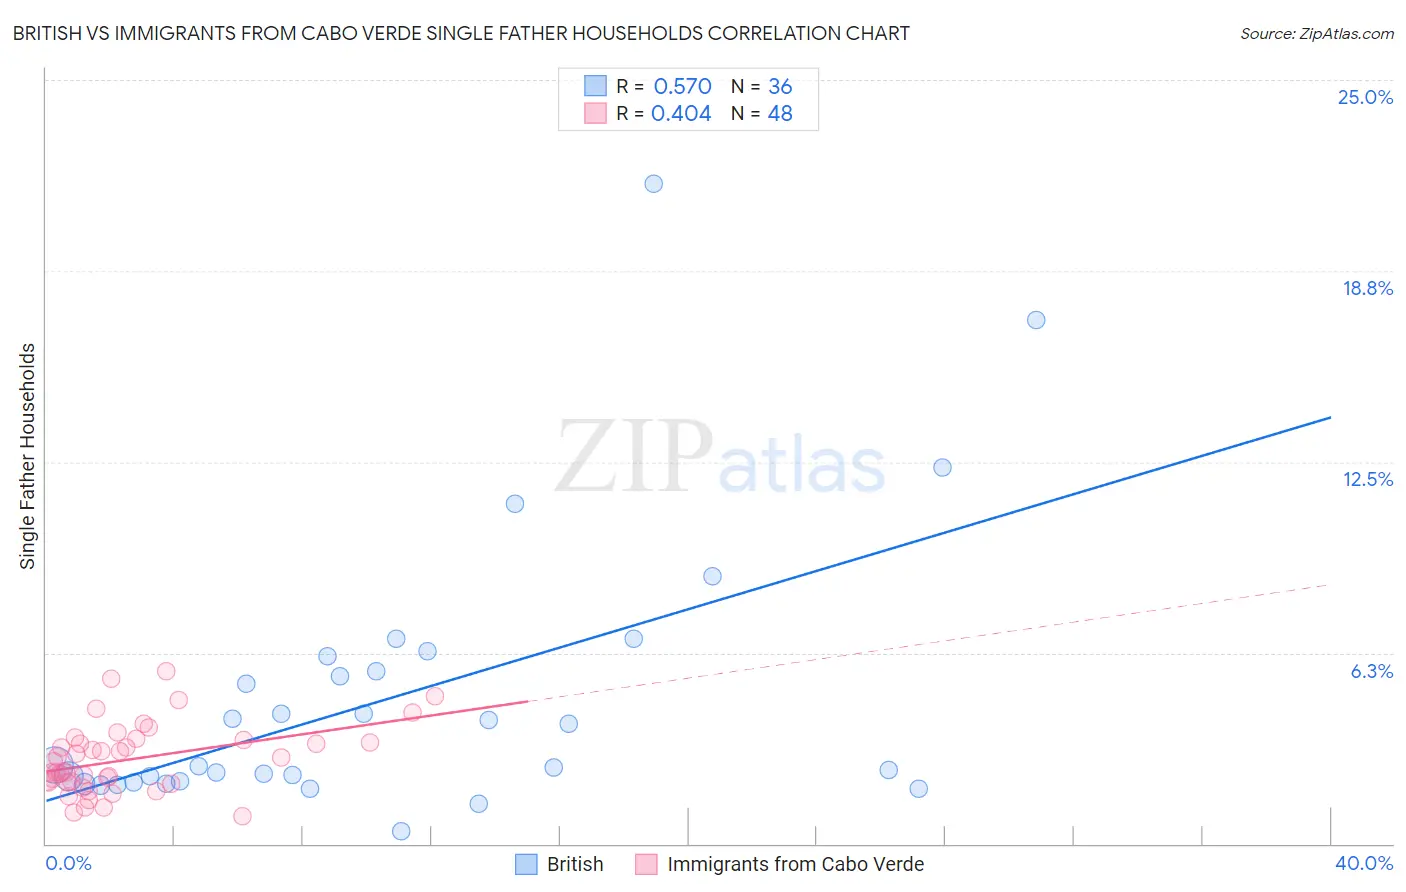
British vs Immigrants from Cabo Verde Single Father Households Correlation Chart
The statistical analysis conducted on geographies consisting of 521,356,549 people shows a substantial positive correlation between the proportion of British and percentage of single father households in the United States with a correlation coefficient (R) of 0.570 and weighted average of 2.2%. Similarly, the statistical analysis conducted on geographies consisting of 37,970,954 people shows a moderate positive correlation between the proportion of Immigrants from Cabo Verde and percentage of single father households in the United States with a correlation coefficient (R) of 0.404 and weighted average of 3.1%, a difference of 38.6%.
Single Father Households Correlation Summary
| Measurement | British | Immigrants from Cabo Verde |
| Minimum | 0.41% | 0.90% |
| Maximum | 21.6% | 5.6% |
| Range | 21.2% | 4.7% |
| Mean | 4.8% | 2.8% |
| Median | 2.6% | 2.5% |
| Interquartile 25% (IQ1) | 2.0% | 2.0% |
| Interquartile 75% (IQ3) | 5.9% | 3.3% |
| Interquartile Range (IQR) | 3.9% | 1.3% |
| Standard Deviation (Sample) | 4.5% | 1.1% |
| Standard Deviation (Population) | 4.5% | 1.1% |
Similar Demographics by Single Father Households
Demographics Similar to British by Single Father Households
In terms of single father households, the demographic groups most similar to British are Brazilian (2.2%, a difference of 0.010%), Laotian (2.2%, a difference of 0.090%), Luxembourger (2.2%, a difference of 0.13%), Immigrants from Nepal (2.2%, a difference of 0.19%), and West Indian (2.2%, a difference of 0.43%).
| Demographics | Rating | Rank | Single Father Households |
| Taiwanese | 96.3 /100 | #133 | Exceptional 2.2% |
| Zimbabweans | 95.1 /100 | #134 | Exceptional 2.2% |
| Syrians | 94.8 /100 | #135 | Exceptional 2.2% |
| Chileans | 94.5 /100 | #136 | Exceptional 2.2% |
| Austrians | 94.2 /100 | #137 | Exceptional 2.2% |
| West Indians | 94.1 /100 | #138 | Exceptional 2.2% |
| Brazilians | 92.8 /100 | #139 | Exceptional 2.2% |
| British | 92.8 /100 | #140 | Exceptional 2.2% |
| Laotians | 92.5 /100 | #141 | Exceptional 2.2% |
| Luxembourgers | 92.3 /100 | #142 | Exceptional 2.2% |
| Immigrants | Nepal | 92.1 /100 | #143 | Exceptional 2.2% |
| Slovaks | 90.7 /100 | #144 | Exceptional 2.2% |
| Immigrants | Zimbabwe | 90.2 /100 | #145 | Exceptional 2.2% |
| Northern Europeans | 89.8 /100 | #146 | Excellent 2.2% |
| Slavs | 88.9 /100 | #147 | Excellent 2.2% |
Demographics Similar to Immigrants from Cabo Verde by Single Father Households
In terms of single father households, the demographic groups most similar to Immigrants from Cabo Verde are Chippewa (3.1%, a difference of 0.10%), Bangladeshi (3.1%, a difference of 0.55%), Nepalese (3.1%, a difference of 0.98%), Aleut (3.0%, a difference of 1.4%), and Immigrants from Mexico (3.0%, a difference of 1.6%).
| Demographics | Rating | Rank | Single Father Households |
| Mexicans | 0.0 /100 | #321 | Tragic 3.0% |
| Immigrants | Guatemala | 0.0 /100 | #322 | Tragic 3.0% |
| Immigrants | Central America | 0.0 /100 | #323 | Tragic 3.0% |
| Fijians | 0.0 /100 | #324 | Tragic 3.0% |
| Immigrants | Mexico | 0.0 /100 | #325 | Tragic 3.0% |
| Aleuts | 0.0 /100 | #326 | Tragic 3.0% |
| Bangladeshis | 0.0 /100 | #327 | Tragic 3.1% |
| Immigrants | Cabo Verde | 0.0 /100 | #328 | Tragic 3.1% |
| Chippewa | 0.0 /100 | #329 | Tragic 3.1% |
| Nepalese | 0.0 /100 | #330 | Tragic 3.1% |
| Navajo | 0.0 /100 | #331 | Tragic 3.2% |
| Yaqui | 0.0 /100 | #332 | Tragic 3.2% |
| Natives/Alaskans | 0.0 /100 | #333 | Tragic 3.2% |
| Yuman | 0.0 /100 | #334 | Tragic 3.3% |
| Colville | 0.0 /100 | #335 | Tragic 3.3% |