British vs Immigrants from Chile Single Father Households
COMPARE
British
Immigrants from Chile
Single Father Households
Single Father Households Comparison
British
Immigrants from Chile
2.2%
SINGLE FATHER HOUSEHOLDS
92.8/ 100
METRIC RATING
140th/ 347
METRIC RANK
2.2%
SINGLE FATHER HOUSEHOLDS
96.7/ 100
METRIC RATING
130th/ 347
METRIC RANK
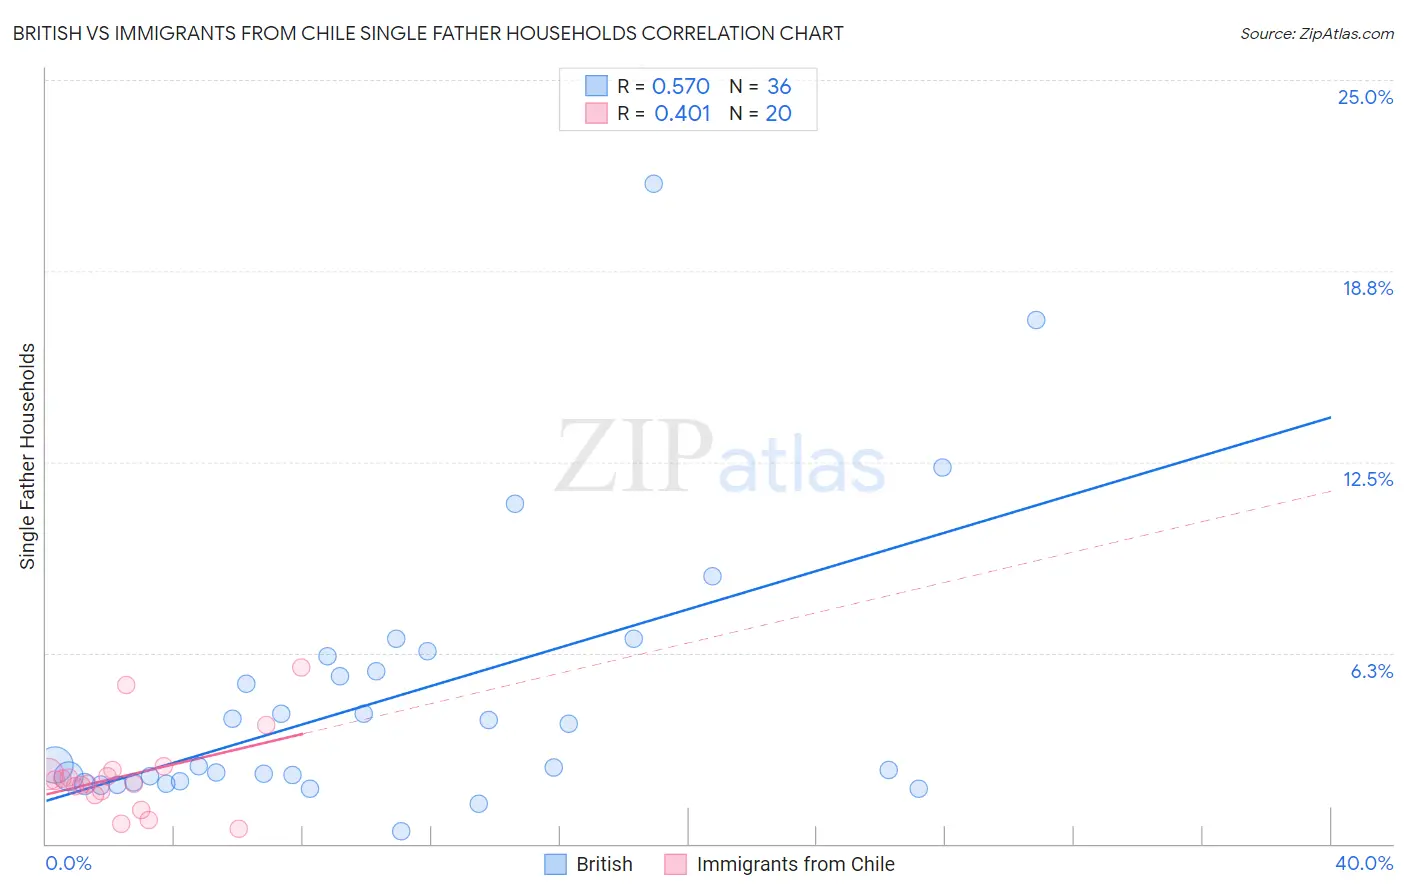
British vs Immigrants from Chile Single Father Households Correlation Chart
The statistical analysis conducted on geographies consisting of 521,356,549 people shows a substantial positive correlation between the proportion of British and percentage of single father households in the United States with a correlation coefficient (R) of 0.570 and weighted average of 2.2%. Similarly, the statistical analysis conducted on geographies consisting of 217,839,905 people shows a moderate positive correlation between the proportion of Immigrants from Chile and percentage of single father households in the United States with a correlation coefficient (R) of 0.401 and weighted average of 2.2%, a difference of 1.6%.
Single Father Households Correlation Summary
| Measurement | British | Immigrants from Chile |
| Minimum | 0.41% | 0.50% |
| Maximum | 21.6% | 5.8% |
| Range | 21.2% | 5.3% |
| Mean | 4.8% | 2.2% |
| Median | 2.6% | 2.0% |
| Interquartile 25% (IQ1) | 2.0% | 1.7% |
| Interquartile 75% (IQ3) | 5.9% | 2.3% |
| Interquartile Range (IQR) | 3.9% | 0.69% |
| Standard Deviation (Sample) | 4.5% | 1.3% |
| Standard Deviation (Population) | 4.5% | 1.3% |
Demographics Similar to British and Immigrants from Chile by Single Father Households
In terms of single father households, the demographic groups most similar to British are Brazilian (2.2%, a difference of 0.010%), Laotian (2.2%, a difference of 0.090%), Luxembourger (2.2%, a difference of 0.13%), Immigrants from Nepal (2.2%, a difference of 0.19%), and West Indian (2.2%, a difference of 0.43%). Similarly, the demographic groups most similar to Immigrants from Chile are Immigrants from Jordan (2.2%, a difference of 0.060%), Polish (2.2%, a difference of 0.070%), Serbian (2.2%, a difference of 0.11%), Immigrants from England (2.2%, a difference of 0.12%), and Moroccan (2.2%, a difference of 0.17%).
| Demographics | Rating | Rank | Single Father Households |
| Immigrants | Indonesia | 97.4 /100 | #125 | Exceptional 2.2% |
| Moroccans | 96.9 /100 | #126 | Exceptional 2.2% |
| Jordanians | 96.9 /100 | #127 | Exceptional 2.2% |
| Immigrants | England | 96.8 /100 | #128 | Exceptional 2.2% |
| Serbians | 96.8 /100 | #129 | Exceptional 2.2% |
| Immigrants | Chile | 96.7 /100 | #130 | Exceptional 2.2% |
| Immigrants | Jordan | 96.6 /100 | #131 | Exceptional 2.2% |
| Poles | 96.5 /100 | #132 | Exceptional 2.2% |
| Taiwanese | 96.3 /100 | #133 | Exceptional 2.2% |
| Zimbabweans | 95.1 /100 | #134 | Exceptional 2.2% |
| Syrians | 94.8 /100 | #135 | Exceptional 2.2% |
| Chileans | 94.5 /100 | #136 | Exceptional 2.2% |
| Austrians | 94.2 /100 | #137 | Exceptional 2.2% |
| West Indians | 94.1 /100 | #138 | Exceptional 2.2% |
| Brazilians | 92.8 /100 | #139 | Exceptional 2.2% |
| British | 92.8 /100 | #140 | Exceptional 2.2% |
| Laotians | 92.5 /100 | #141 | Exceptional 2.2% |
| Luxembourgers | 92.3 /100 | #142 | Exceptional 2.2% |
| Immigrants | Nepal | 92.1 /100 | #143 | Exceptional 2.2% |
| Slovaks | 90.7 /100 | #144 | Exceptional 2.2% |
| Immigrants | Zimbabwe | 90.2 /100 | #145 | Exceptional 2.2% |