British vs Immigrants from Cabo Verde Doctorate Degree
COMPARE
British
Immigrants from Cabo Verde
Doctorate Degree
Doctorate Degree Comparison
British
Immigrants from Cabo Verde
2.2%
DOCTORATE DEGREE
99.3/ 100
METRIC RATING
89th/ 347
METRIC RANK
1.3%
DOCTORATE DEGREE
0.0/ 100
METRIC RATING
326th/ 347
METRIC RANK
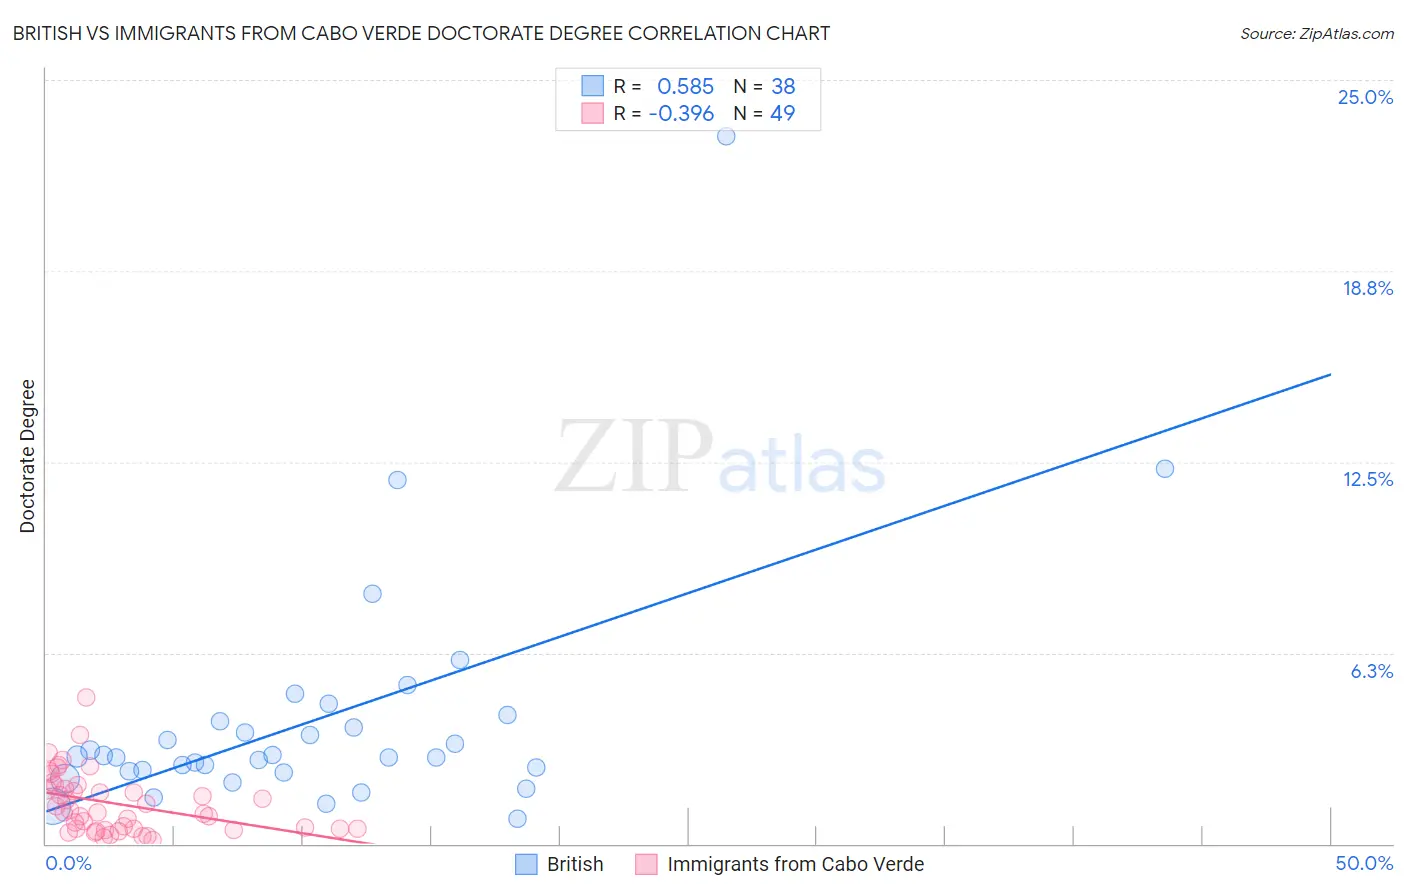
British vs Immigrants from Cabo Verde Doctorate Degree Correlation Chart
The statistical analysis conducted on geographies consisting of 517,011,664 people shows a substantial positive correlation between the proportion of British and percentage of population with at least doctorate degree education in the United States with a correlation coefficient (R) of 0.585 and weighted average of 2.2%. Similarly, the statistical analysis conducted on geographies consisting of 38,072,290 people shows a mild negative correlation between the proportion of Immigrants from Cabo Verde and percentage of population with at least doctorate degree education in the United States with a correlation coefficient (R) of -0.396 and weighted average of 1.3%, a difference of 64.4%.
Doctorate Degree Correlation Summary
| Measurement | British | Immigrants from Cabo Verde |
| Minimum | 0.83% | 0.14% |
| Maximum | 23.1% | 4.8% |
| Range | 22.3% | 4.7% |
| Mean | 4.1% | 1.3% |
| Median | 2.8% | 1.0% |
| Interquartile 25% (IQ1) | 2.4% | 0.49% |
| Interquartile 75% (IQ3) | 4.0% | 1.9% |
| Interquartile Range (IQR) | 1.6% | 1.4% |
| Standard Deviation (Sample) | 4.0% | 0.99% |
| Standard Deviation (Population) | 4.0% | 0.98% |
Similar Demographics by Doctorate Degree
Demographics Similar to British by Doctorate Degree
In terms of doctorate degree, the demographic groups most similar to British are Immigrants from Scotland (2.2%, a difference of 0.020%), Immigrants from Nepal (2.2%, a difference of 0.44%), Immigrants from Sudan (2.2%, a difference of 0.49%), Chilean (2.2%, a difference of 0.75%), and Immigrants from Zimbabwe (2.2%, a difference of 0.80%).
| Demographics | Rating | Rank | Doctorate Degree |
| Immigrants | Uganda | 99.6 /100 | #82 | Exceptional 2.2% |
| Immigrants | Lithuania | 99.6 /100 | #83 | Exceptional 2.2% |
| Immigrants | England | 99.6 /100 | #84 | Exceptional 2.2% |
| Immigrants | Brazil | 99.6 /100 | #85 | Exceptional 2.2% |
| Egyptians | 99.4 /100 | #86 | Exceptional 2.2% |
| Immigrants | Zimbabwe | 99.4 /100 | #87 | Exceptional 2.2% |
| Immigrants | Nepal | 99.3 /100 | #88 | Exceptional 2.2% |
| British | 99.3 /100 | #89 | Exceptional 2.2% |
| Immigrants | Scotland | 99.2 /100 | #90 | Exceptional 2.2% |
| Immigrants | Sudan | 99.1 /100 | #91 | Exceptional 2.2% |
| Chileans | 99.1 /100 | #92 | Exceptional 2.2% |
| Alsatians | 99.0 /100 | #93 | Exceptional 2.1% |
| Greeks | 98.8 /100 | #94 | Exceptional 2.1% |
| Immigrants | Romania | 98.7 /100 | #95 | Exceptional 2.1% |
| Immigrants | Northern Africa | 98.4 /100 | #96 | Exceptional 2.1% |
Demographics Similar to Immigrants from Cabo Verde by Doctorate Degree
In terms of doctorate degree, the demographic groups most similar to Immigrants from Cabo Verde are Pima (1.3%, a difference of 0.020%), Hispanic or Latino (1.3%, a difference of 0.29%), Native/Alaskan (1.3%, a difference of 0.41%), Immigrants from Belize (1.3%, a difference of 0.74%), and Inupiat (1.3%, a difference of 0.87%).
| Demographics | Rating | Rank | Doctorate Degree |
| Immigrants | Guyana | 0.1 /100 | #319 | Tragic 1.3% |
| Immigrants | St. Vincent and the Grenadines | 0.1 /100 | #320 | Tragic 1.3% |
| Dutch West Indians | 0.1 /100 | #321 | Tragic 1.3% |
| Seminole | 0.1 /100 | #322 | Tragic 1.3% |
| Immigrants | Belize | 0.1 /100 | #323 | Tragic 1.3% |
| Natives/Alaskans | 0.0 /100 | #324 | Tragic 1.3% |
| Pima | 0.0 /100 | #325 | Tragic 1.3% |
| Immigrants | Cabo Verde | 0.0 /100 | #326 | Tragic 1.3% |
| Hispanics or Latinos | 0.0 /100 | #327 | Tragic 1.3% |
| Inupiat | 0.0 /100 | #328 | Tragic 1.3% |
| Haitians | 0.0 /100 | #329 | Tragic 1.3% |
| Yup'ik | 0.0 /100 | #330 | Tragic 1.3% |
| Immigrants | Latin America | 0.0 /100 | #331 | Tragic 1.3% |
| Yakama | 0.0 /100 | #332 | Tragic 1.3% |
| Immigrants | Caribbean | 0.0 /100 | #333 | Tragic 1.3% |