British vs Immigrants from Netherlands Single Father Households
COMPARE
British
Immigrants from Netherlands
Single Father Households
Single Father Households Comparison
British
Immigrants from Netherlands
2.2%
SINGLE FATHER HOUSEHOLDS
92.8/ 100
METRIC RATING
140th/ 347
METRIC RANK
2.2%
SINGLE FATHER HOUSEHOLDS
98.5/ 100
METRIC RATING
108th/ 347
METRIC RANK
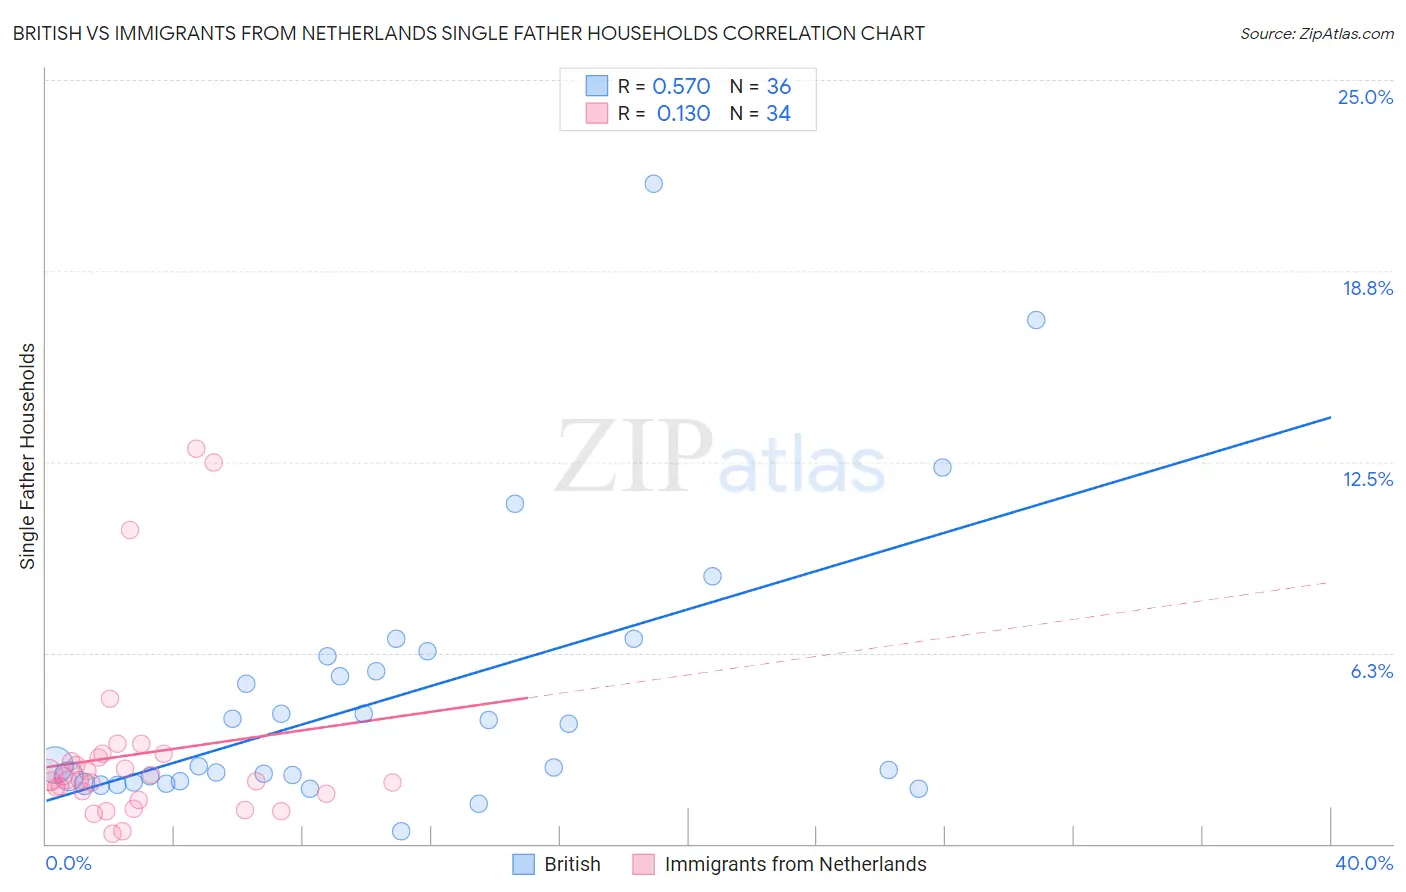
British vs Immigrants from Netherlands Single Father Households Correlation Chart
The statistical analysis conducted on geographies consisting of 521,356,549 people shows a substantial positive correlation between the proportion of British and percentage of single father households in the United States with a correlation coefficient (R) of 0.570 and weighted average of 2.2%. Similarly, the statistical analysis conducted on geographies consisting of 236,298,420 people shows a poor positive correlation between the proportion of Immigrants from Netherlands and percentage of single father households in the United States with a correlation coefficient (R) of 0.130 and weighted average of 2.2%, a difference of 3.2%.
Single Father Households Correlation Summary
| Measurement | British | Immigrants from Netherlands |
| Minimum | 0.41% | 0.33% |
| Maximum | 21.6% | 12.9% |
| Range | 21.2% | 12.6% |
| Mean | 4.8% | 2.9% |
| Median | 2.6% | 2.1% |
| Interquartile 25% (IQ1) | 2.0% | 1.6% |
| Interquartile 75% (IQ3) | 5.9% | 2.8% |
| Interquartile Range (IQR) | 3.9% | 1.2% |
| Standard Deviation (Sample) | 4.5% | 3.0% |
| Standard Deviation (Population) | 4.5% | 2.9% |
Similar Demographics by Single Father Households
Demographics Similar to British by Single Father Households
In terms of single father households, the demographic groups most similar to British are Brazilian (2.2%, a difference of 0.010%), Laotian (2.2%, a difference of 0.090%), Luxembourger (2.2%, a difference of 0.13%), Immigrants from Nepal (2.2%, a difference of 0.19%), and West Indian (2.2%, a difference of 0.43%).
| Demographics | Rating | Rank | Single Father Households |
| Taiwanese | 96.3 /100 | #133 | Exceptional 2.2% |
| Zimbabweans | 95.1 /100 | #134 | Exceptional 2.2% |
| Syrians | 94.8 /100 | #135 | Exceptional 2.2% |
| Chileans | 94.5 /100 | #136 | Exceptional 2.2% |
| Austrians | 94.2 /100 | #137 | Exceptional 2.2% |
| West Indians | 94.1 /100 | #138 | Exceptional 2.2% |
| Brazilians | 92.8 /100 | #139 | Exceptional 2.2% |
| British | 92.8 /100 | #140 | Exceptional 2.2% |
| Laotians | 92.5 /100 | #141 | Exceptional 2.2% |
| Luxembourgers | 92.3 /100 | #142 | Exceptional 2.2% |
| Immigrants | Nepal | 92.1 /100 | #143 | Exceptional 2.2% |
| Slovaks | 90.7 /100 | #144 | Exceptional 2.2% |
| Immigrants | Zimbabwe | 90.2 /100 | #145 | Exceptional 2.2% |
| Northern Europeans | 89.8 /100 | #146 | Excellent 2.2% |
| Slavs | 88.9 /100 | #147 | Excellent 2.2% |
Demographics Similar to Immigrants from Netherlands by Single Father Households
In terms of single father households, the demographic groups most similar to Immigrants from Netherlands are Slovene (2.2%, a difference of 0.020%), Barbadian (2.2%, a difference of 0.040%), Immigrants from Southern Europe (2.2%, a difference of 0.14%), Italian (2.2%, a difference of 0.16%), and Immigrants from Canada (2.2%, a difference of 0.24%).
| Demographics | Rating | Rank | Single Father Households |
| Immigrants | Western Europe | 98.9 /100 | #101 | Exceptional 2.1% |
| Argentineans | 98.9 /100 | #102 | Exceptional 2.1% |
| Lebanese | 98.9 /100 | #103 | Exceptional 2.1% |
| Alsatians | 98.9 /100 | #104 | Exceptional 2.1% |
| Palestinians | 98.6 /100 | #105 | Exceptional 2.2% |
| Immigrants | Southern Europe | 98.6 /100 | #106 | Exceptional 2.2% |
| Slovenes | 98.5 /100 | #107 | Exceptional 2.2% |
| Immigrants | Netherlands | 98.5 /100 | #108 | Exceptional 2.2% |
| Barbadians | 98.4 /100 | #109 | Exceptional 2.2% |
| Italians | 98.3 /100 | #110 | Exceptional 2.2% |
| Immigrants | Canada | 98.3 /100 | #111 | Exceptional 2.2% |
| Immigrants | Trinidad and Tobago | 98.2 /100 | #112 | Exceptional 2.2% |
| Iraqis | 98.2 /100 | #113 | Exceptional 2.2% |
| Immigrants | North America | 98.2 /100 | #114 | Exceptional 2.2% |
| Immigrants | Barbados | 98.2 /100 | #115 | Exceptional 2.2% |