Central American vs Immigrants from Cabo Verde Single Father Households
COMPARE
Central American
Immigrants from Cabo Verde
Single Father Households
Single Father Households Comparison
Central Americans
Immigrants from Cabo Verde
2.9%
SINGLE FATHER HOUSEHOLDS
0.0/ 100
METRIC RATING
309th/ 347
METRIC RANK
3.1%
SINGLE FATHER HOUSEHOLDS
0.0/ 100
METRIC RATING
328th/ 347
METRIC RANK
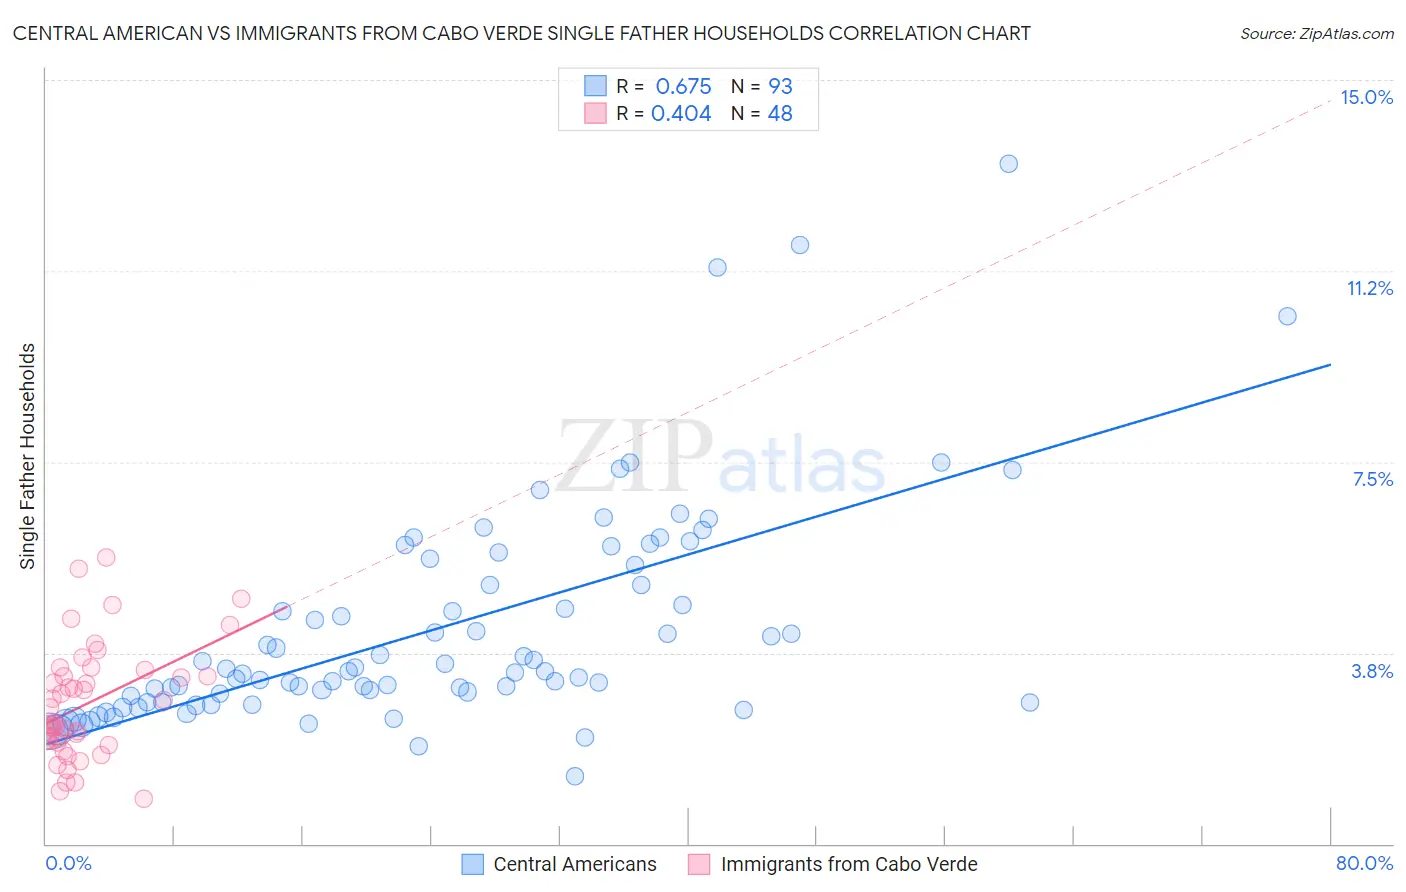
Central American vs Immigrants from Cabo Verde Single Father Households Correlation Chart
The statistical analysis conducted on geographies consisting of 497,759,507 people shows a significant positive correlation between the proportion of Central Americans and percentage of single father households in the United States with a correlation coefficient (R) of 0.675 and weighted average of 2.9%. Similarly, the statistical analysis conducted on geographies consisting of 37,970,954 people shows a moderate positive correlation between the proportion of Immigrants from Cabo Verde and percentage of single father households in the United States with a correlation coefficient (R) of 0.404 and weighted average of 3.1%, a difference of 8.2%.
Single Father Households Correlation Summary
| Measurement | Central American | Immigrants from Cabo Verde |
| Minimum | 1.3% | 0.90% |
| Maximum | 13.4% | 5.6% |
| Range | 12.0% | 4.7% |
| Mean | 4.2% | 2.8% |
| Median | 3.4% | 2.5% |
| Interquartile 25% (IQ1) | 2.8% | 2.0% |
| Interquartile 75% (IQ3) | 5.3% | 3.3% |
| Interquartile Range (IQR) | 2.5% | 1.3% |
| Standard Deviation (Sample) | 2.2% | 1.1% |
| Standard Deviation (Population) | 2.2% | 1.1% |
Demographics Similar to Central Americans and Immigrants from Cabo Verde by Single Father Households
In terms of single father households, the demographic groups most similar to Central Americans are Immigrants from Laos (2.9%, a difference of 0.21%), Spanish American Indian (2.9%, a difference of 0.69%), Apache (2.8%, a difference of 0.71%), Tsimshian (2.9%, a difference of 1.3%), and Arapaho (2.9%, a difference of 1.7%). Similarly, the demographic groups most similar to Immigrants from Cabo Verde are Bangladeshi (3.1%, a difference of 0.55%), Aleut (3.0%, a difference of 1.4%), Immigrants from Mexico (3.0%, a difference of 1.6%), Fijian (3.0%, a difference of 2.8%), and Immigrants from Central America (3.0%, a difference of 2.9%).
| Demographics | Rating | Rank | Single Father Households |
| Apache | 0.0 /100 | #308 | Tragic 2.8% |
| Central Americans | 0.0 /100 | #309 | Tragic 2.9% |
| Immigrants | Laos | 0.0 /100 | #310 | Tragic 2.9% |
| Spanish American Indians | 0.0 /100 | #311 | Tragic 2.9% |
| Tsimshian | 0.0 /100 | #312 | Tragic 2.9% |
| Arapaho | 0.0 /100 | #313 | Tragic 2.9% |
| Salvadorans | 0.0 /100 | #314 | Tragic 2.9% |
| Cheyenne | 0.0 /100 | #315 | Tragic 2.9% |
| Houma | 0.0 /100 | #316 | Tragic 2.9% |
| Immigrants | El Salvador | 0.0 /100 | #317 | Tragic 2.9% |
| Cape Verdeans | 0.0 /100 | #318 | Tragic 2.9% |
| Ute | 0.0 /100 | #319 | Tragic 3.0% |
| Guatemalans | 0.0 /100 | #320 | Tragic 3.0% |
| Mexicans | 0.0 /100 | #321 | Tragic 3.0% |
| Immigrants | Guatemala | 0.0 /100 | #322 | Tragic 3.0% |
| Immigrants | Central America | 0.0 /100 | #323 | Tragic 3.0% |
| Fijians | 0.0 /100 | #324 | Tragic 3.0% |
| Immigrants | Mexico | 0.0 /100 | #325 | Tragic 3.0% |
| Aleuts | 0.0 /100 | #326 | Tragic 3.0% |
| Bangladeshis | 0.0 /100 | #327 | Tragic 3.1% |
| Immigrants | Cabo Verde | 0.0 /100 | #328 | Tragic 3.1% |