Lebanese vs Immigrants from Cabo Verde Single Father Households
COMPARE
Lebanese
Immigrants from Cabo Verde
Single Father Households
Single Father Households Comparison
Lebanese
Immigrants from Cabo Verde
2.1%
SINGLE FATHER HOUSEHOLDS
98.9/ 100
METRIC RATING
103rd/ 347
METRIC RANK
3.1%
SINGLE FATHER HOUSEHOLDS
0.0/ 100
METRIC RATING
328th/ 347
METRIC RANK
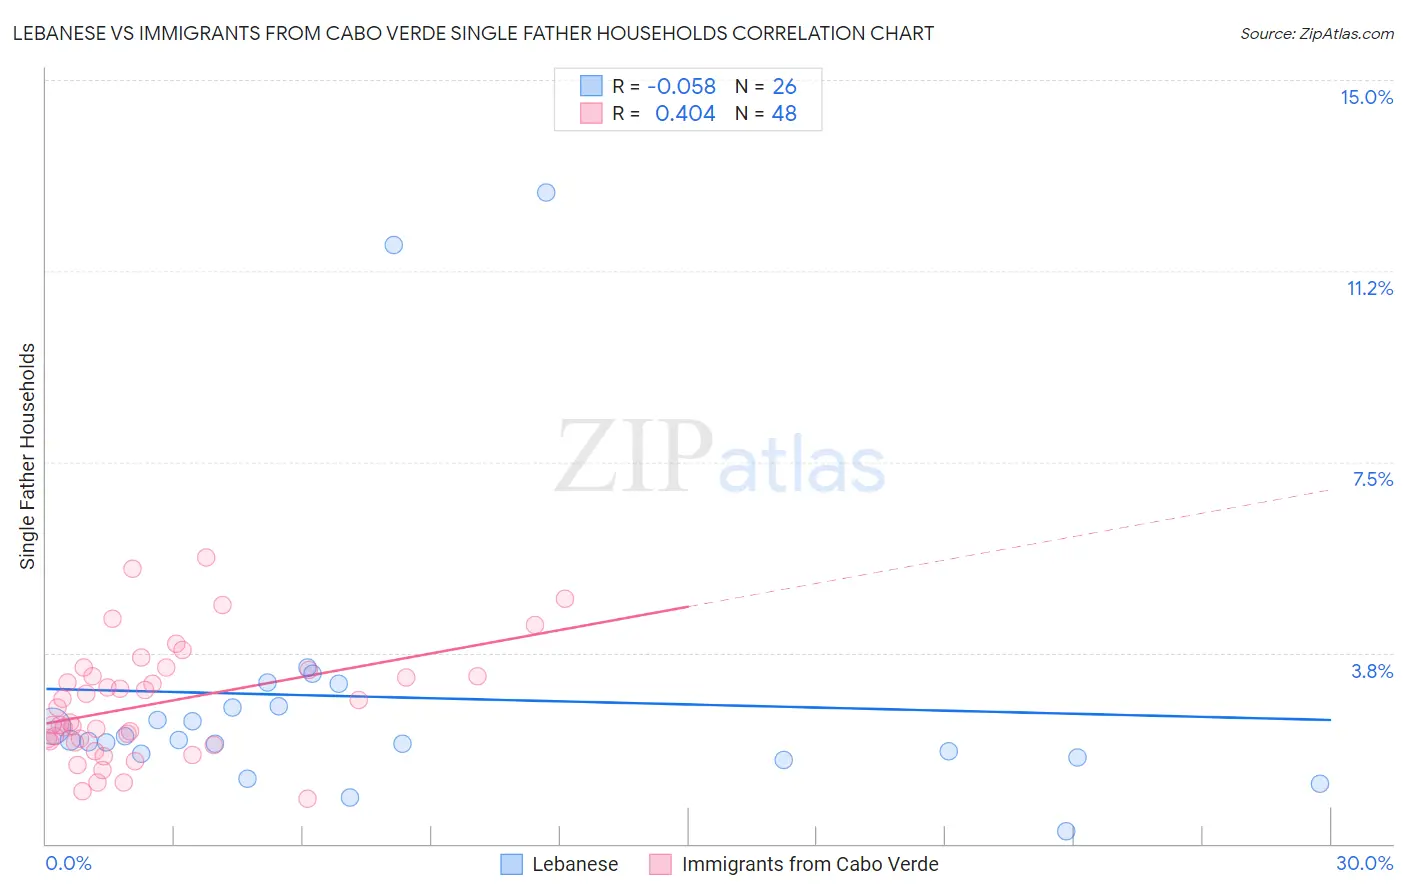
Lebanese vs Immigrants from Cabo Verde Single Father Households Correlation Chart
The statistical analysis conducted on geographies consisting of 397,908,440 people shows a slight negative correlation between the proportion of Lebanese and percentage of single father households in the United States with a correlation coefficient (R) of -0.058 and weighted average of 2.1%. Similarly, the statistical analysis conducted on geographies consisting of 37,970,954 people shows a moderate positive correlation between the proportion of Immigrants from Cabo Verde and percentage of single father households in the United States with a correlation coefficient (R) of 0.404 and weighted average of 3.1%, a difference of 44.0%.
Single Father Households Correlation Summary
| Measurement | Lebanese | Immigrants from Cabo Verde |
| Minimum | 0.25% | 0.90% |
| Maximum | 12.8% | 5.6% |
| Range | 12.5% | 4.7% |
| Mean | 2.9% | 2.8% |
| Median | 2.0% | 2.5% |
| Interquartile 25% (IQ1) | 1.8% | 2.0% |
| Interquartile 75% (IQ3) | 2.7% | 3.3% |
| Interquartile Range (IQR) | 0.94% | 1.3% |
| Standard Deviation (Sample) | 2.9% | 1.1% |
| Standard Deviation (Population) | 2.8% | 1.1% |
Similar Demographics by Single Father Households
Demographics Similar to Lebanese by Single Father Households
In terms of single father households, the demographic groups most similar to Lebanese are Argentinean (2.1%, a difference of 0.020%), Alsatian (2.1%, a difference of 0.020%), Immigrants from Western Europe (2.1%, a difference of 0.050%), Immigrants from Northern Africa (2.1%, a difference of 0.20%), and South African (2.1%, a difference of 0.35%).
| Demographics | Rating | Rank | Single Father Households |
| Arabs | 99.2 /100 | #96 | Exceptional 2.1% |
| Immigrants | Moldova | 99.1 /100 | #97 | Exceptional 2.1% |
| Guyanese | 99.1 /100 | #98 | Exceptional 2.1% |
| South Africans | 99.1 /100 | #99 | Exceptional 2.1% |
| Immigrants | Northern Africa | 99.0 /100 | #100 | Exceptional 2.1% |
| Immigrants | Western Europe | 98.9 /100 | #101 | Exceptional 2.1% |
| Argentineans | 98.9 /100 | #102 | Exceptional 2.1% |
| Lebanese | 98.9 /100 | #103 | Exceptional 2.1% |
| Alsatians | 98.9 /100 | #104 | Exceptional 2.1% |
| Palestinians | 98.6 /100 | #105 | Exceptional 2.2% |
| Immigrants | Southern Europe | 98.6 /100 | #106 | Exceptional 2.2% |
| Slovenes | 98.5 /100 | #107 | Exceptional 2.2% |
| Immigrants | Netherlands | 98.5 /100 | #108 | Exceptional 2.2% |
| Barbadians | 98.4 /100 | #109 | Exceptional 2.2% |
| Italians | 98.3 /100 | #110 | Exceptional 2.2% |
Demographics Similar to Immigrants from Cabo Verde by Single Father Households
In terms of single father households, the demographic groups most similar to Immigrants from Cabo Verde are Chippewa (3.1%, a difference of 0.10%), Bangladeshi (3.1%, a difference of 0.55%), Nepalese (3.1%, a difference of 0.98%), Aleut (3.0%, a difference of 1.4%), and Immigrants from Mexico (3.0%, a difference of 1.6%).
| Demographics | Rating | Rank | Single Father Households |
| Mexicans | 0.0 /100 | #321 | Tragic 3.0% |
| Immigrants | Guatemala | 0.0 /100 | #322 | Tragic 3.0% |
| Immigrants | Central America | 0.0 /100 | #323 | Tragic 3.0% |
| Fijians | 0.0 /100 | #324 | Tragic 3.0% |
| Immigrants | Mexico | 0.0 /100 | #325 | Tragic 3.0% |
| Aleuts | 0.0 /100 | #326 | Tragic 3.0% |
| Bangladeshis | 0.0 /100 | #327 | Tragic 3.1% |
| Immigrants | Cabo Verde | 0.0 /100 | #328 | Tragic 3.1% |
| Chippewa | 0.0 /100 | #329 | Tragic 3.1% |
| Nepalese | 0.0 /100 | #330 | Tragic 3.1% |
| Navajo | 0.0 /100 | #331 | Tragic 3.2% |
| Yaqui | 0.0 /100 | #332 | Tragic 3.2% |
| Natives/Alaskans | 0.0 /100 | #333 | Tragic 3.2% |
| Yuman | 0.0 /100 | #334 | Tragic 3.3% |
| Colville | 0.0 /100 | #335 | Tragic 3.3% |