Menominee vs Immigrants from Cabo Verde Single Father Households
COMPARE
Menominee
Immigrants from Cabo Verde
Single Father Households
Single Father Households Comparison
Menominee
Immigrants from Cabo Verde
4.2%
SINGLE FATHER HOUSEHOLDS
0.0/ 100
METRIC RATING
345th/ 347
METRIC RANK
3.1%
SINGLE FATHER HOUSEHOLDS
0.0/ 100
METRIC RATING
328th/ 347
METRIC RANK
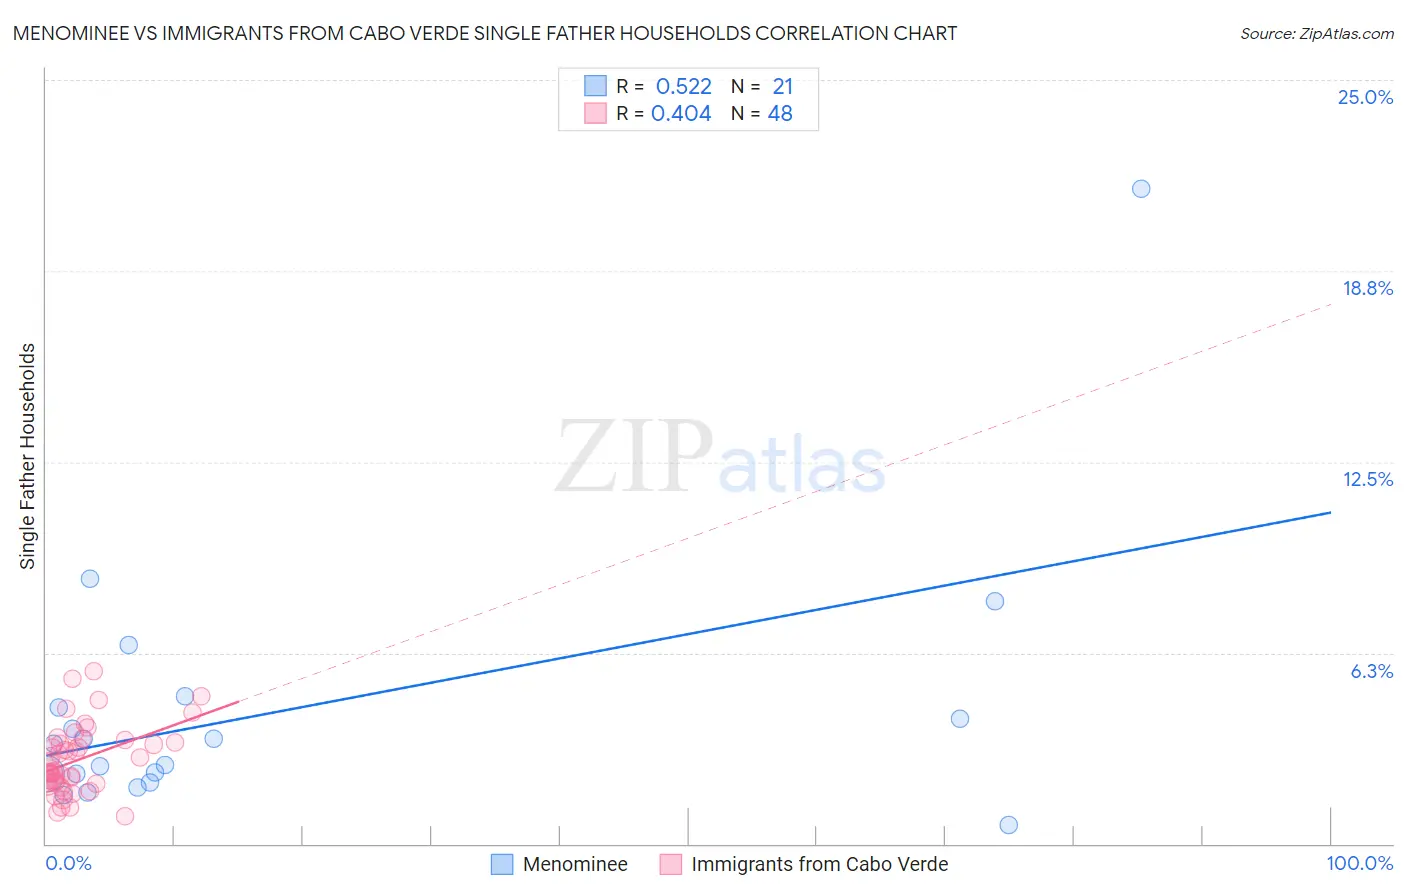
Menominee vs Immigrants from Cabo Verde Single Father Households Correlation Chart
The statistical analysis conducted on geographies consisting of 45,722,024 people shows a substantial positive correlation between the proportion of Menominee and percentage of single father households in the United States with a correlation coefficient (R) of 0.522 and weighted average of 4.2%. Similarly, the statistical analysis conducted on geographies consisting of 37,970,954 people shows a moderate positive correlation between the proportion of Immigrants from Cabo Verde and percentage of single father households in the United States with a correlation coefficient (R) of 0.404 and weighted average of 3.1%, a difference of 36.5%.
Single Father Households Correlation Summary
| Measurement | Menominee | Immigrants from Cabo Verde |
| Minimum | 0.60% | 0.90% |
| Maximum | 21.4% | 5.6% |
| Range | 20.8% | 4.7% |
| Mean | 4.4% | 2.8% |
| Median | 3.3% | 2.5% |
| Interquartile 25% (IQ1) | 2.1% | 2.0% |
| Interquartile 75% (IQ3) | 4.7% | 3.3% |
| Interquartile Range (IQR) | 2.5% | 1.3% |
| Standard Deviation (Sample) | 4.4% | 1.1% |
| Standard Deviation (Population) | 4.3% | 1.1% |
Demographics Similar to Menominee and Immigrants from Cabo Verde by Single Father Households
In terms of single father households, the demographic groups most similar to Menominee are Yakama (4.2%, a difference of 0.69%), Pima (4.2%, a difference of 0.93%), Tohono O'odham (3.8%, a difference of 10.2%), Inupiat (4.9%, a difference of 15.3%), and Crow (3.5%, a difference of 19.9%). Similarly, the demographic groups most similar to Immigrants from Cabo Verde are Chippewa (3.1%, a difference of 0.10%), Bangladeshi (3.1%, a difference of 0.55%), Nepalese (3.1%, a difference of 0.98%), Aleut (3.0%, a difference of 1.4%), and Navajo (3.2%, a difference of 3.3%).
| Demographics | Rating | Rank | Single Father Households |
| Aleuts | 0.0 /100 | #326 | Tragic 3.0% |
| Bangladeshis | 0.0 /100 | #327 | Tragic 3.1% |
| Immigrants | Cabo Verde | 0.0 /100 | #328 | Tragic 3.1% |
| Chippewa | 0.0 /100 | #329 | Tragic 3.1% |
| Nepalese | 0.0 /100 | #330 | Tragic 3.1% |
| Navajo | 0.0 /100 | #331 | Tragic 3.2% |
| Yaqui | 0.0 /100 | #332 | Tragic 3.2% |
| Natives/Alaskans | 0.0 /100 | #333 | Tragic 3.2% |
| Yuman | 0.0 /100 | #334 | Tragic 3.3% |
| Colville | 0.0 /100 | #335 | Tragic 3.3% |
| Paiute | 0.0 /100 | #336 | Tragic 3.3% |
| Pueblo | 0.0 /100 | #337 | Tragic 3.3% |
| Sioux | 0.0 /100 | #338 | Tragic 3.3% |
| Alaskan Athabascans | 0.0 /100 | #339 | Tragic 3.4% |
| Alaska Natives | 0.0 /100 | #340 | Tragic 3.5% |
| Crow | 0.0 /100 | #341 | Tragic 3.5% |
| Tohono O'odham | 0.0 /100 | #342 | Tragic 3.8% |
| Pima | 0.0 /100 | #343 | Tragic 4.2% |
| Yakama | 0.0 /100 | #344 | Tragic 4.2% |
| Menominee | 0.0 /100 | #345 | Tragic 4.2% |
| Inupiat | 0.0 /100 | #346 | Tragic 4.9% |