British vs Macedonian Single Father Households
COMPARE
British
Macedonian
Single Father Households
Single Father Households Comparison
British
Macedonians
2.2%
SINGLE FATHER HOUSEHOLDS
92.8/ 100
METRIC RATING
140th/ 347
METRIC RANK
2.0%
SINGLE FATHER HOUSEHOLDS
100.0/ 100
METRIC RATING
42nd/ 347
METRIC RANK
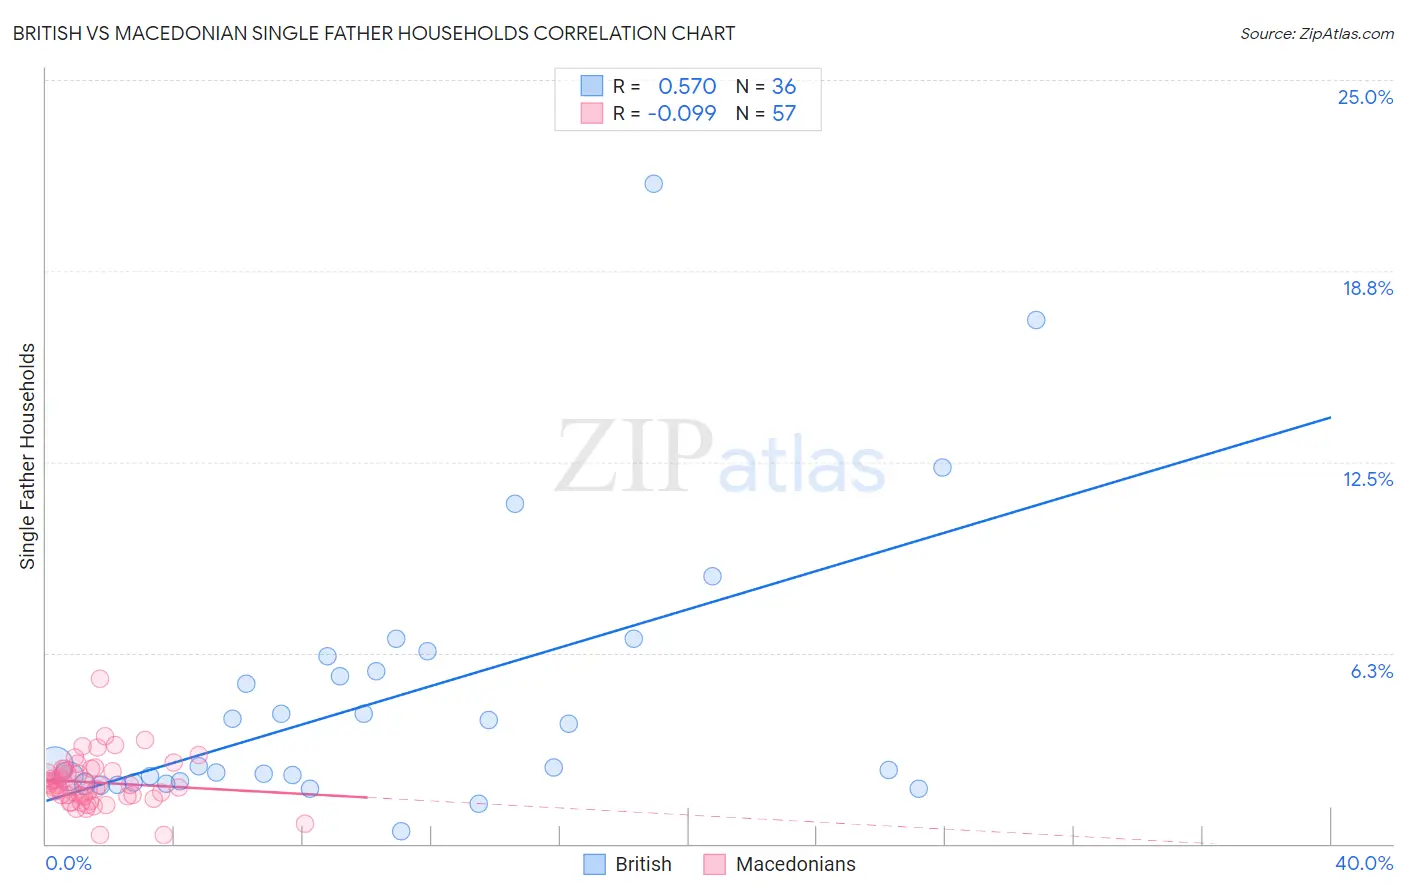
British vs Macedonian Single Father Households Correlation Chart
The statistical analysis conducted on geographies consisting of 521,356,549 people shows a substantial positive correlation between the proportion of British and percentage of single father households in the United States with a correlation coefficient (R) of 0.570 and weighted average of 2.2%. Similarly, the statistical analysis conducted on geographies consisting of 132,178,370 people shows a slight negative correlation between the proportion of Macedonians and percentage of single father households in the United States with a correlation coefficient (R) of -0.099 and weighted average of 2.0%, a difference of 11.5%.
Single Father Households Correlation Summary
| Measurement | British | Macedonian |
| Minimum | 0.41% | 0.27% |
| Maximum | 21.6% | 5.4% |
| Range | 21.2% | 5.1% |
| Mean | 4.8% | 2.0% |
| Median | 2.6% | 1.9% |
| Interquartile 25% (IQ1) | 2.0% | 1.6% |
| Interquartile 75% (IQ3) | 5.9% | 2.4% |
| Interquartile Range (IQR) | 3.9% | 0.86% |
| Standard Deviation (Sample) | 4.5% | 0.83% |
| Standard Deviation (Population) | 4.5% | 0.82% |
Similar Demographics by Single Father Households
Demographics Similar to British by Single Father Households
In terms of single father households, the demographic groups most similar to British are Brazilian (2.2%, a difference of 0.010%), Laotian (2.2%, a difference of 0.090%), Luxembourger (2.2%, a difference of 0.13%), Immigrants from Nepal (2.2%, a difference of 0.19%), and West Indian (2.2%, a difference of 0.43%).
| Demographics | Rating | Rank | Single Father Households |
| Taiwanese | 96.3 /100 | #133 | Exceptional 2.2% |
| Zimbabweans | 95.1 /100 | #134 | Exceptional 2.2% |
| Syrians | 94.8 /100 | #135 | Exceptional 2.2% |
| Chileans | 94.5 /100 | #136 | Exceptional 2.2% |
| Austrians | 94.2 /100 | #137 | Exceptional 2.2% |
| West Indians | 94.1 /100 | #138 | Exceptional 2.2% |
| Brazilians | 92.8 /100 | #139 | Exceptional 2.2% |
| British | 92.8 /100 | #140 | Exceptional 2.2% |
| Laotians | 92.5 /100 | #141 | Exceptional 2.2% |
| Luxembourgers | 92.3 /100 | #142 | Exceptional 2.2% |
| Immigrants | Nepal | 92.1 /100 | #143 | Exceptional 2.2% |
| Slovaks | 90.7 /100 | #144 | Exceptional 2.2% |
| Immigrants | Zimbabwe | 90.2 /100 | #145 | Exceptional 2.2% |
| Northern Europeans | 89.8 /100 | #146 | Excellent 2.2% |
| Slavs | 88.9 /100 | #147 | Excellent 2.2% |
Demographics Similar to Macedonians by Single Father Households
In terms of single father households, the demographic groups most similar to Macedonians are Immigrants from Turkey (2.0%, a difference of 0.15%), Immigrants from Grenada (2.0%, a difference of 0.23%), Latvian (2.0%, a difference of 0.31%), Immigrants from Bulgaria (2.0%, a difference of 0.33%), and Russian (2.0%, a difference of 0.33%).
| Demographics | Rating | Rank | Single Father Households |
| Albanians | 100.0 /100 | #35 | Exceptional 2.0% |
| Immigrants | Belgium | 100.0 /100 | #36 | Exceptional 2.0% |
| Immigrants | St. Vincent and the Grenadines | 100.0 /100 | #37 | Exceptional 2.0% |
| Immigrants | Eastern Europe | 100.0 /100 | #38 | Exceptional 2.0% |
| Immigrants | Sri Lanka | 100.0 /100 | #39 | Exceptional 2.0% |
| Immigrants | Bulgaria | 100.0 /100 | #40 | Exceptional 2.0% |
| Immigrants | Turkey | 100.0 /100 | #41 | Exceptional 2.0% |
| Macedonians | 100.0 /100 | #42 | Exceptional 2.0% |
| Immigrants | Grenada | 100.0 /100 | #43 | Exceptional 2.0% |
| Latvians | 100.0 /100 | #44 | Exceptional 2.0% |
| Russians | 100.0 /100 | #45 | Exceptional 2.0% |
| Immigrants | Lebanon | 100.0 /100 | #46 | Exceptional 2.0% |
| Immigrants | Ukraine | 99.9 /100 | #47 | Exceptional 2.0% |
| Immigrants | Kazakhstan | 99.9 /100 | #48 | Exceptional 2.0% |
| Immigrants | Serbia | 99.9 /100 | #49 | Exceptional 2.0% |