British vs Thai Single Father Households
COMPARE
British
Thai
Single Father Households
Single Father Households Comparison
British
Thais
2.2%
SINGLE FATHER HOUSEHOLDS
92.8/ 100
METRIC RATING
140th/ 347
METRIC RANK
1.9%
SINGLE FATHER HOUSEHOLDS
100.0/ 100
METRIC RATING
20th/ 347
METRIC RANK
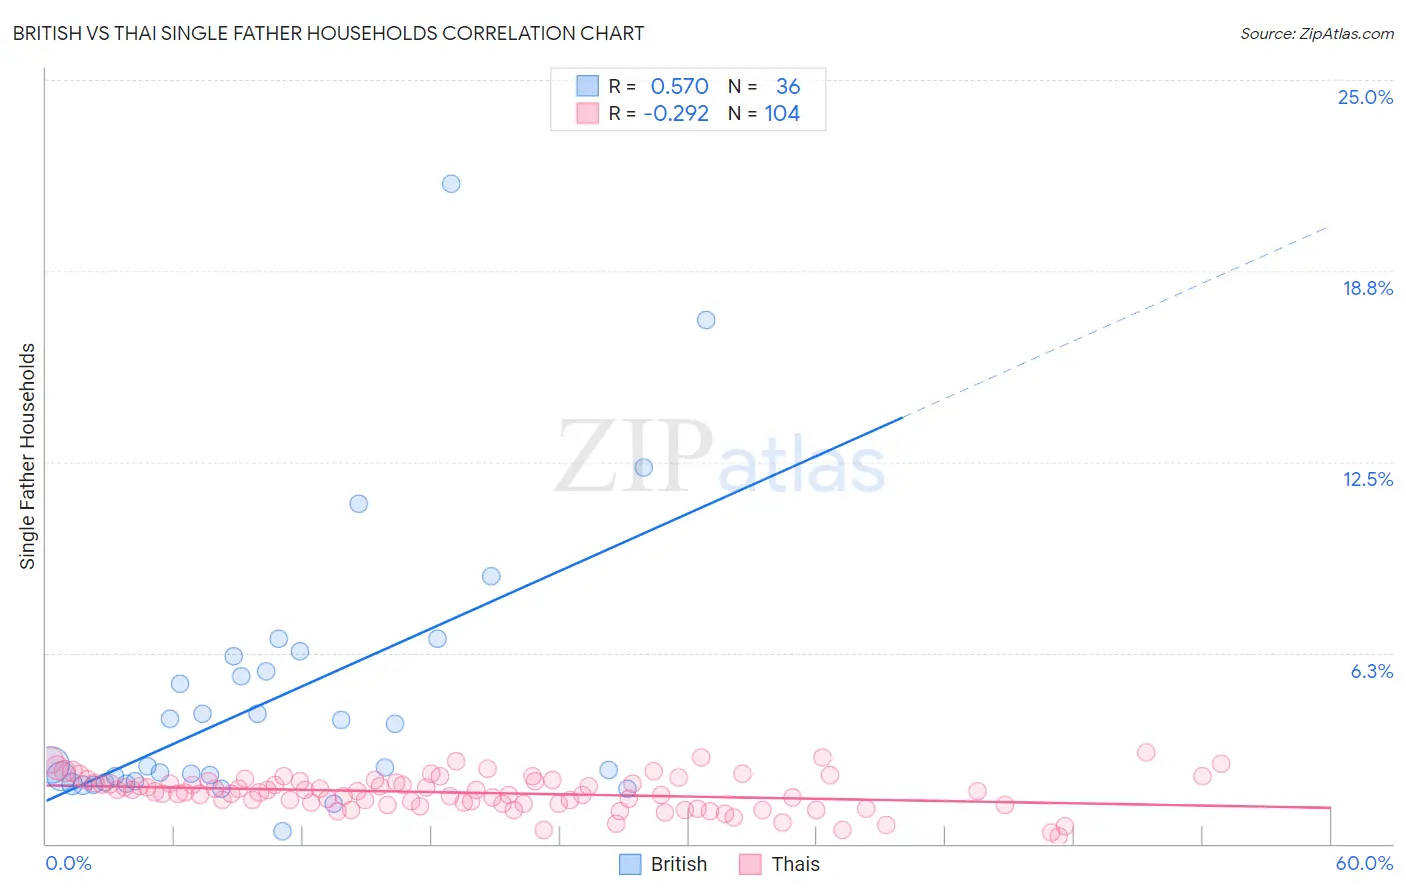
British vs Thai Single Father Households Correlation Chart
The statistical analysis conducted on geographies consisting of 521,356,549 people shows a substantial positive correlation between the proportion of British and percentage of single father households in the United States with a correlation coefficient (R) of 0.570 and weighted average of 2.2%. Similarly, the statistical analysis conducted on geographies consisting of 470,214,576 people shows a weak negative correlation between the proportion of Thais and percentage of single father households in the United States with a correlation coefficient (R) of -0.292 and weighted average of 1.9%, a difference of 15.9%.
Single Father Households Correlation Summary
| Measurement | British | Thai |
| Minimum | 0.41% | 0.26% |
| Maximum | 21.6% | 3.0% |
| Range | 21.2% | 2.7% |
| Mean | 4.8% | 1.7% |
| Median | 2.6% | 1.7% |
| Interquartile 25% (IQ1) | 2.0% | 1.3% |
| Interquartile 75% (IQ3) | 5.9% | 2.0% |
| Interquartile Range (IQR) | 3.9% | 0.72% |
| Standard Deviation (Sample) | 4.5% | 0.56% |
| Standard Deviation (Population) | 4.5% | 0.56% |
Similar Demographics by Single Father Households
Demographics Similar to British by Single Father Households
In terms of single father households, the demographic groups most similar to British are Brazilian (2.2%, a difference of 0.010%), Laotian (2.2%, a difference of 0.090%), Luxembourger (2.2%, a difference of 0.13%), Immigrants from Nepal (2.2%, a difference of 0.19%), and West Indian (2.2%, a difference of 0.43%).
| Demographics | Rating | Rank | Single Father Households |
| Taiwanese | 96.3 /100 | #133 | Exceptional 2.2% |
| Zimbabweans | 95.1 /100 | #134 | Exceptional 2.2% |
| Syrians | 94.8 /100 | #135 | Exceptional 2.2% |
| Chileans | 94.5 /100 | #136 | Exceptional 2.2% |
| Austrians | 94.2 /100 | #137 | Exceptional 2.2% |
| West Indians | 94.1 /100 | #138 | Exceptional 2.2% |
| Brazilians | 92.8 /100 | #139 | Exceptional 2.2% |
| British | 92.8 /100 | #140 | Exceptional 2.2% |
| Laotians | 92.5 /100 | #141 | Exceptional 2.2% |
| Luxembourgers | 92.3 /100 | #142 | Exceptional 2.2% |
| Immigrants | Nepal | 92.1 /100 | #143 | Exceptional 2.2% |
| Slovaks | 90.7 /100 | #144 | Exceptional 2.2% |
| Immigrants | Zimbabwe | 90.2 /100 | #145 | Exceptional 2.2% |
| Northern Europeans | 89.8 /100 | #146 | Excellent 2.2% |
| Slavs | 88.9 /100 | #147 | Excellent 2.2% |
Demographics Similar to Thais by Single Father Households
In terms of single father households, the demographic groups most similar to Thais are Iranian (1.9%, a difference of 0.070%), Immigrants from Albania (1.9%, a difference of 0.30%), Immigrants from Latvia (1.9%, a difference of 0.49%), Indian (Asian) (1.9%, a difference of 0.91%), and Immigrants from India (1.9%, a difference of 1.4%).
| Demographics | Rating | Rank | Single Father Households |
| Immigrants | Singapore | 100.0 /100 | #13 | Exceptional 1.9% |
| Immigrants | Lithuania | 100.0 /100 | #14 | Exceptional 1.9% |
| Immigrants | Eastern Asia | 100.0 /100 | #15 | Exceptional 1.9% |
| Immigrants | Iran | 100.0 /100 | #16 | Exceptional 1.9% |
| Immigrants | India | 100.0 /100 | #17 | Exceptional 1.9% |
| Indians (Asian) | 100.0 /100 | #18 | Exceptional 1.9% |
| Iranians | 100.0 /100 | #19 | Exceptional 1.9% |
| Thais | 100.0 /100 | #20 | Exceptional 1.9% |
| Immigrants | Albania | 100.0 /100 | #21 | Exceptional 1.9% |
| Immigrants | Latvia | 100.0 /100 | #22 | Exceptional 1.9% |
| Immigrants | Croatia | 100.0 /100 | #23 | Exceptional 2.0% |
| Immigrants | Russia | 100.0 /100 | #24 | Exceptional 2.0% |
| Eastern Europeans | 100.0 /100 | #25 | Exceptional 2.0% |
| Assyrians/Chaldeans/Syriacs | 100.0 /100 | #26 | Exceptional 2.0% |
| Immigrants | South Central Asia | 100.0 /100 | #27 | Exceptional 2.0% |