British vs Cheyenne Single Father Households
COMPARE
British
Cheyenne
Single Father Households
Single Father Households Comparison
British
Cheyenne
2.2%
SINGLE FATHER HOUSEHOLDS
92.8/ 100
METRIC RATING
140th/ 347
METRIC RANK
2.9%
SINGLE FATHER HOUSEHOLDS
0.0/ 100
METRIC RATING
315th/ 347
METRIC RANK
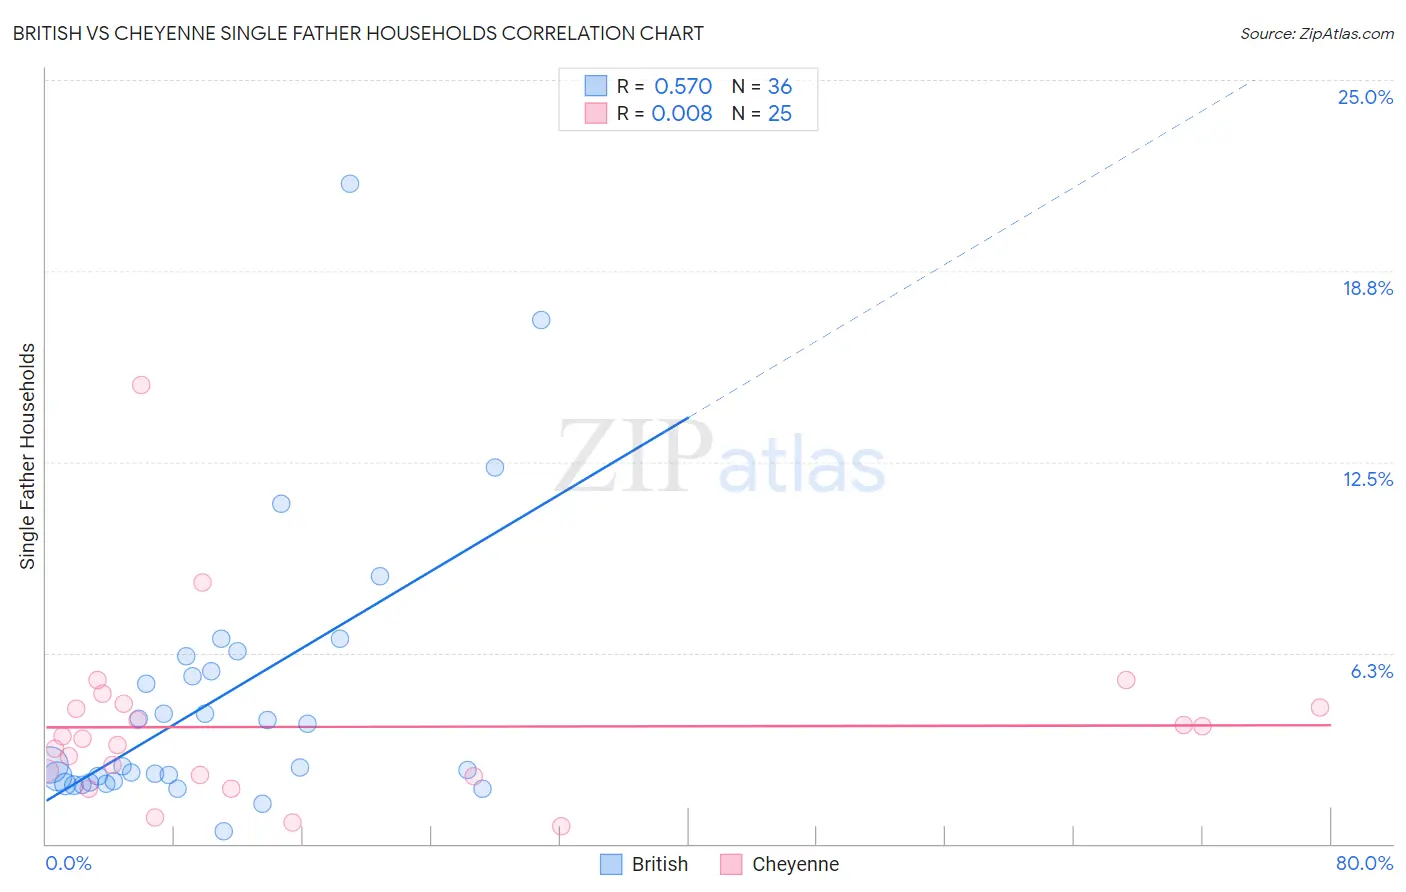
British vs Cheyenne Single Father Households Correlation Chart
The statistical analysis conducted on geographies consisting of 521,356,549 people shows a substantial positive correlation between the proportion of British and percentage of single father households in the United States with a correlation coefficient (R) of 0.570 and weighted average of 2.2%. Similarly, the statistical analysis conducted on geographies consisting of 80,479,252 people shows no correlation between the proportion of Cheyenne and percentage of single father households in the United States with a correlation coefficient (R) of 0.008 and weighted average of 2.9%, a difference of 31.1%.
Single Father Households Correlation Summary
| Measurement | British | Cheyenne |
| Minimum | 0.41% | 0.55% |
| Maximum | 21.6% | 15.0% |
| Range | 21.2% | 14.4% |
| Mean | 4.8% | 3.8% |
| Median | 2.6% | 3.4% |
| Interquartile 25% (IQ1) | 2.0% | 2.2% |
| Interquartile 75% (IQ3) | 5.9% | 4.5% |
| Interquartile Range (IQR) | 3.9% | 2.3% |
| Standard Deviation (Sample) | 4.5% | 2.9% |
| Standard Deviation (Population) | 4.5% | 2.8% |
Similar Demographics by Single Father Households
Demographics Similar to British by Single Father Households
In terms of single father households, the demographic groups most similar to British are Brazilian (2.2%, a difference of 0.010%), Laotian (2.2%, a difference of 0.090%), Luxembourger (2.2%, a difference of 0.13%), Immigrants from Nepal (2.2%, a difference of 0.19%), and West Indian (2.2%, a difference of 0.43%).
| Demographics | Rating | Rank | Single Father Households |
| Taiwanese | 96.3 /100 | #133 | Exceptional 2.2% |
| Zimbabweans | 95.1 /100 | #134 | Exceptional 2.2% |
| Syrians | 94.8 /100 | #135 | Exceptional 2.2% |
| Chileans | 94.5 /100 | #136 | Exceptional 2.2% |
| Austrians | 94.2 /100 | #137 | Exceptional 2.2% |
| West Indians | 94.1 /100 | #138 | Exceptional 2.2% |
| Brazilians | 92.8 /100 | #139 | Exceptional 2.2% |
| British | 92.8 /100 | #140 | Exceptional 2.2% |
| Laotians | 92.5 /100 | #141 | Exceptional 2.2% |
| Luxembourgers | 92.3 /100 | #142 | Exceptional 2.2% |
| Immigrants | Nepal | 92.1 /100 | #143 | Exceptional 2.2% |
| Slovaks | 90.7 /100 | #144 | Exceptional 2.2% |
| Immigrants | Zimbabwe | 90.2 /100 | #145 | Exceptional 2.2% |
| Northern Europeans | 89.8 /100 | #146 | Excellent 2.2% |
| Slavs | 88.9 /100 | #147 | Excellent 2.2% |
Demographics Similar to Cheyenne by Single Father Households
In terms of single father households, the demographic groups most similar to Cheyenne are Houma (2.9%, a difference of 0.0%), Salvadoran (2.9%, a difference of 0.39%), Arapaho (2.9%, a difference of 0.64%), Immigrants from El Salvador (2.9%, a difference of 0.86%), and Cape Verdean (2.9%, a difference of 0.87%).
| Demographics | Rating | Rank | Single Father Households |
| Apache | 0.0 /100 | #308 | Tragic 2.8% |
| Central Americans | 0.0 /100 | #309 | Tragic 2.9% |
| Immigrants | Laos | 0.0 /100 | #310 | Tragic 2.9% |
| Spanish American Indians | 0.0 /100 | #311 | Tragic 2.9% |
| Tsimshian | 0.0 /100 | #312 | Tragic 2.9% |
| Arapaho | 0.0 /100 | #313 | Tragic 2.9% |
| Salvadorans | 0.0 /100 | #314 | Tragic 2.9% |
| Cheyenne | 0.0 /100 | #315 | Tragic 2.9% |
| Houma | 0.0 /100 | #316 | Tragic 2.9% |
| Immigrants | El Salvador | 0.0 /100 | #317 | Tragic 2.9% |
| Cape Verdeans | 0.0 /100 | #318 | Tragic 2.9% |
| Ute | 0.0 /100 | #319 | Tragic 3.0% |
| Guatemalans | 0.0 /100 | #320 | Tragic 3.0% |
| Mexicans | 0.0 /100 | #321 | Tragic 3.0% |
| Immigrants | Guatemala | 0.0 /100 | #322 | Tragic 3.0% |