Kenyan vs Immigrants from Cabo Verde Single Father Households
COMPARE
Kenyan
Immigrants from Cabo Verde
Single Father Households
Single Father Households Comparison
Kenyans
Immigrants from Cabo Verde
2.4%
SINGLE FATHER HOUSEHOLDS
28.0/ 100
METRIC RATING
196th/ 347
METRIC RANK
3.1%
SINGLE FATHER HOUSEHOLDS
0.0/ 100
METRIC RATING
328th/ 347
METRIC RANK
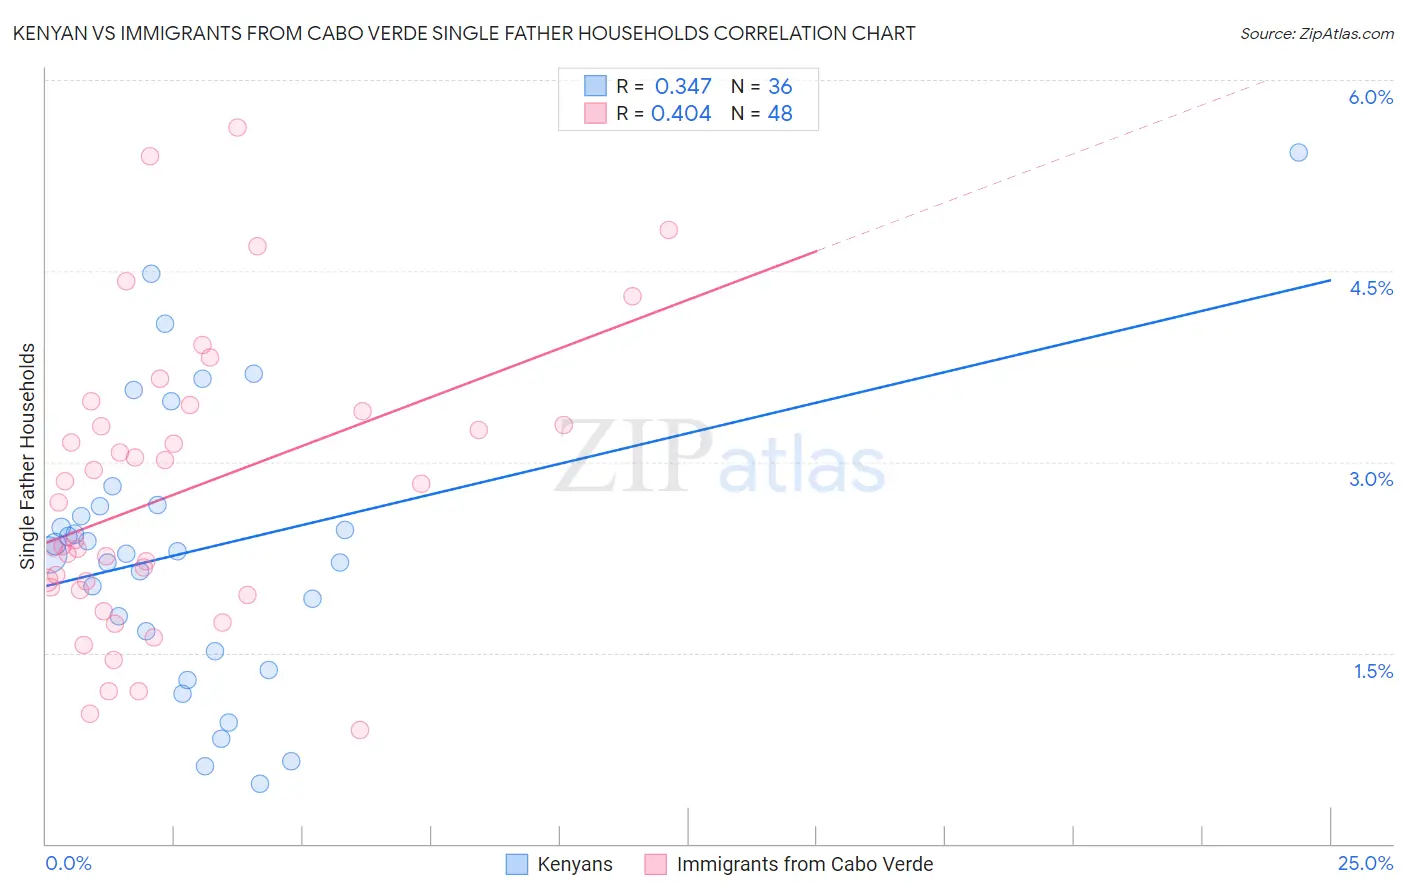
Kenyan vs Immigrants from Cabo Verde Single Father Households Correlation Chart
The statistical analysis conducted on geographies consisting of 167,815,034 people shows a mild positive correlation between the proportion of Kenyans and percentage of single father households in the United States with a correlation coefficient (R) of 0.347 and weighted average of 2.4%. Similarly, the statistical analysis conducted on geographies consisting of 37,970,954 people shows a moderate positive correlation between the proportion of Immigrants from Cabo Verde and percentage of single father households in the United States with a correlation coefficient (R) of 0.404 and weighted average of 3.1%, a difference of 29.8%.
Single Father Households Correlation Summary
| Measurement | Kenyan | Immigrants from Cabo Verde |
| Minimum | 0.47% | 0.90% |
| Maximum | 5.4% | 5.6% |
| Range | 5.0% | 4.7% |
| Mean | 2.3% | 2.8% |
| Median | 2.3% | 2.5% |
| Interquartile 25% (IQ1) | 1.6% | 2.0% |
| Interquartile 75% (IQ3) | 2.7% | 3.3% |
| Interquartile Range (IQR) | 1.1% | 1.3% |
| Standard Deviation (Sample) | 1.1% | 1.1% |
| Standard Deviation (Population) | 1.1% | 1.1% |
Similar Demographics by Single Father Households
Demographics Similar to Kenyans by Single Father Households
In terms of single father households, the demographic groups most similar to Kenyans are German (2.4%, a difference of 0.0%), Immigrants from Philippines (2.4%, a difference of 0.060%), Scandinavian (2.4%, a difference of 0.060%), Immigrants from Vietnam (2.4%, a difference of 0.080%), and Peruvian (2.4%, a difference of 0.090%).
| Demographics | Rating | Rank | Single Father Households |
| U.S. Virgin Islanders | 31.8 /100 | #189 | Fair 2.4% |
| French | 31.7 /100 | #190 | Fair 2.4% |
| Immigrants | Africa | 30.0 /100 | #191 | Fair 2.4% |
| Immigrants | Sudan | 29.8 /100 | #192 | Fair 2.4% |
| Uruguayans | 29.7 /100 | #193 | Fair 2.4% |
| Panamanians | 29.6 /100 | #194 | Fair 2.4% |
| Immigrants | Philippines | 28.7 /100 | #195 | Fair 2.4% |
| Kenyans | 28.0 /100 | #196 | Fair 2.4% |
| Germans | 28.0 /100 | #197 | Fair 2.4% |
| Scandinavians | 27.4 /100 | #198 | Fair 2.4% |
| Immigrants | Vietnam | 27.1 /100 | #199 | Fair 2.4% |
| Peruvians | 27.1 /100 | #200 | Fair 2.4% |
| Immigrants | Uganda | 26.0 /100 | #201 | Fair 2.4% |
| German Russians | 25.7 /100 | #202 | Fair 2.4% |
| French Canadians | 24.7 /100 | #203 | Fair 2.4% |
Demographics Similar to Immigrants from Cabo Verde by Single Father Households
In terms of single father households, the demographic groups most similar to Immigrants from Cabo Verde are Chippewa (3.1%, a difference of 0.10%), Bangladeshi (3.1%, a difference of 0.55%), Nepalese (3.1%, a difference of 0.98%), Aleut (3.0%, a difference of 1.4%), and Immigrants from Mexico (3.0%, a difference of 1.6%).
| Demographics | Rating | Rank | Single Father Households |
| Mexicans | 0.0 /100 | #321 | Tragic 3.0% |
| Immigrants | Guatemala | 0.0 /100 | #322 | Tragic 3.0% |
| Immigrants | Central America | 0.0 /100 | #323 | Tragic 3.0% |
| Fijians | 0.0 /100 | #324 | Tragic 3.0% |
| Immigrants | Mexico | 0.0 /100 | #325 | Tragic 3.0% |
| Aleuts | 0.0 /100 | #326 | Tragic 3.0% |
| Bangladeshis | 0.0 /100 | #327 | Tragic 3.1% |
| Immigrants | Cabo Verde | 0.0 /100 | #328 | Tragic 3.1% |
| Chippewa | 0.0 /100 | #329 | Tragic 3.1% |
| Nepalese | 0.0 /100 | #330 | Tragic 3.1% |
| Navajo | 0.0 /100 | #331 | Tragic 3.2% |
| Yaqui | 0.0 /100 | #332 | Tragic 3.2% |
| Natives/Alaskans | 0.0 /100 | #333 | Tragic 3.2% |
| Yuman | 0.0 /100 | #334 | Tragic 3.3% |
| Colville | 0.0 /100 | #335 | Tragic 3.3% |