Jordanian vs Immigrants from Cabo Verde Single Father Households
COMPARE
Jordanian
Immigrants from Cabo Verde
Single Father Households
Single Father Households Comparison
Jordanians
Immigrants from Cabo Verde
2.2%
SINGLE FATHER HOUSEHOLDS
96.9/ 100
METRIC RATING
127th/ 347
METRIC RANK
3.1%
SINGLE FATHER HOUSEHOLDS
0.0/ 100
METRIC RATING
328th/ 347
METRIC RANK
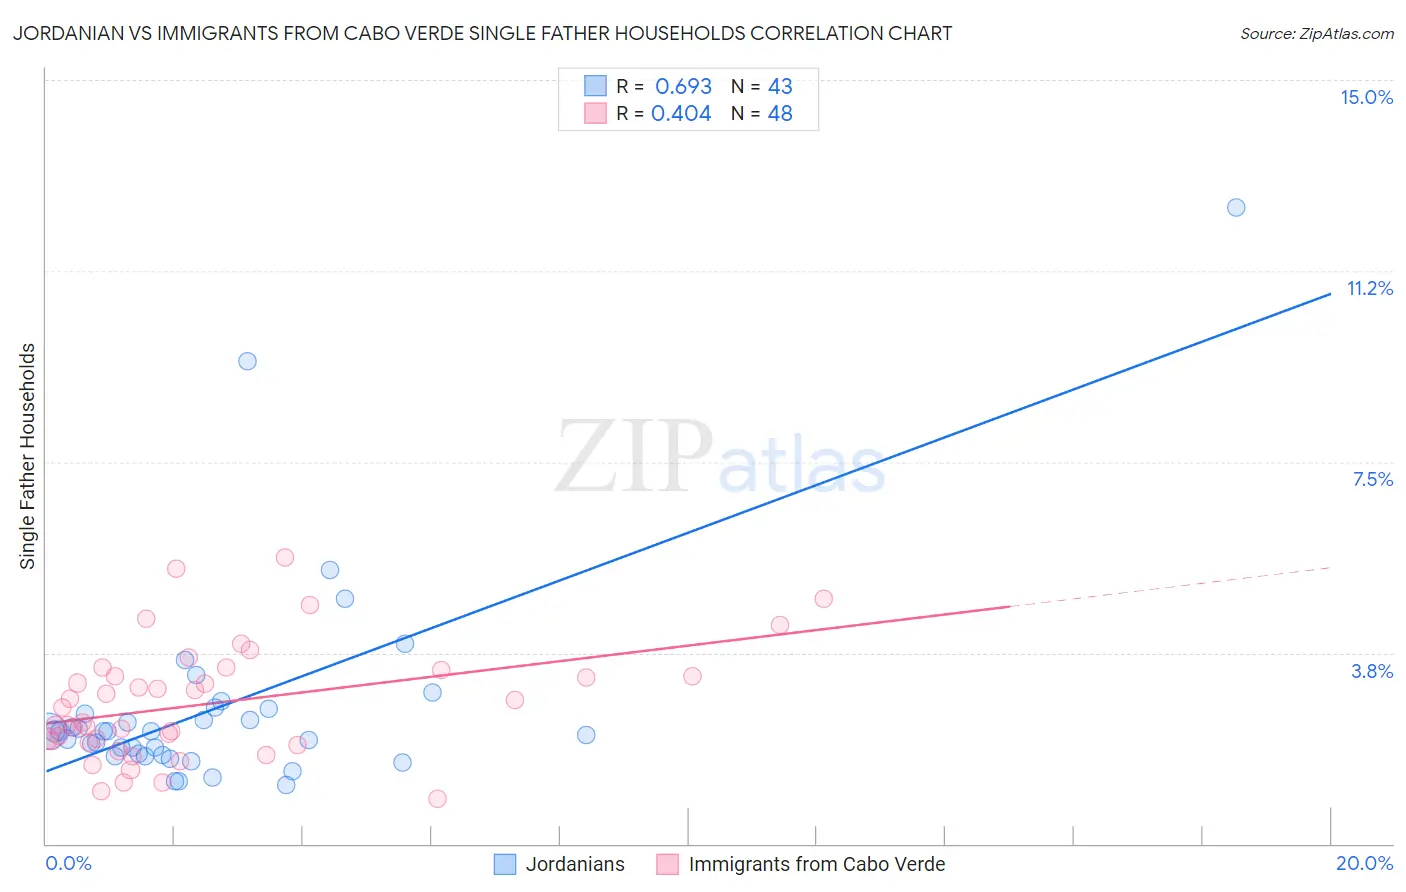
Jordanian vs Immigrants from Cabo Verde Single Father Households Correlation Chart
The statistical analysis conducted on geographies consisting of 165,930,664 people shows a significant positive correlation between the proportion of Jordanians and percentage of single father households in the United States with a correlation coefficient (R) of 0.693 and weighted average of 2.2%. Similarly, the statistical analysis conducted on geographies consisting of 37,970,954 people shows a moderate positive correlation between the proportion of Immigrants from Cabo Verde and percentage of single father households in the United States with a correlation coefficient (R) of 0.404 and weighted average of 3.1%, a difference of 41.0%.
Single Father Households Correlation Summary
| Measurement | Jordanian | Immigrants from Cabo Verde |
| Minimum | 1.1% | 0.90% |
| Maximum | 12.5% | 5.6% |
| Range | 11.4% | 4.7% |
| Mean | 2.7% | 2.8% |
| Median | 2.2% | 2.5% |
| Interquartile 25% (IQ1) | 1.7% | 2.0% |
| Interquartile 75% (IQ3) | 2.6% | 3.3% |
| Interquartile Range (IQR) | 0.89% | 1.3% |
| Standard Deviation (Sample) | 2.1% | 1.1% |
| Standard Deviation (Population) | 2.0% | 1.1% |
Similar Demographics by Single Father Households
Demographics Similar to Jordanians by Single Father Households
In terms of single father households, the demographic groups most similar to Jordanians are Moroccan (2.2%, a difference of 0.0%), Immigrants from England (2.2%, a difference of 0.040%), Serbian (2.2%, a difference of 0.050%), Immigrants from Chile (2.2%, a difference of 0.17%), and Immigrants from Jordan (2.2%, a difference of 0.23%).
| Demographics | Rating | Rank | Single Father Households |
| Australians | 97.7 /100 | #120 | Exceptional 2.2% |
| Immigrants | Brazil | 97.7 /100 | #121 | Exceptional 2.2% |
| Immigrants | Iraq | 97.6 /100 | #122 | Exceptional 2.2% |
| Immigrants | Yemen | 97.5 /100 | #123 | Exceptional 2.2% |
| British West Indians | 97.4 /100 | #124 | Exceptional 2.2% |
| Immigrants | Indonesia | 97.4 /100 | #125 | Exceptional 2.2% |
| Moroccans | 96.9 /100 | #126 | Exceptional 2.2% |
| Jordanians | 96.9 /100 | #127 | Exceptional 2.2% |
| Immigrants | England | 96.8 /100 | #128 | Exceptional 2.2% |
| Serbians | 96.8 /100 | #129 | Exceptional 2.2% |
| Immigrants | Chile | 96.7 /100 | #130 | Exceptional 2.2% |
| Immigrants | Jordan | 96.6 /100 | #131 | Exceptional 2.2% |
| Poles | 96.5 /100 | #132 | Exceptional 2.2% |
| Taiwanese | 96.3 /100 | #133 | Exceptional 2.2% |
| Zimbabweans | 95.1 /100 | #134 | Exceptional 2.2% |
Demographics Similar to Immigrants from Cabo Verde by Single Father Households
In terms of single father households, the demographic groups most similar to Immigrants from Cabo Verde are Chippewa (3.1%, a difference of 0.10%), Bangladeshi (3.1%, a difference of 0.55%), Nepalese (3.1%, a difference of 0.98%), Aleut (3.0%, a difference of 1.4%), and Immigrants from Mexico (3.0%, a difference of 1.6%).
| Demographics | Rating | Rank | Single Father Households |
| Mexicans | 0.0 /100 | #321 | Tragic 3.0% |
| Immigrants | Guatemala | 0.0 /100 | #322 | Tragic 3.0% |
| Immigrants | Central America | 0.0 /100 | #323 | Tragic 3.0% |
| Fijians | 0.0 /100 | #324 | Tragic 3.0% |
| Immigrants | Mexico | 0.0 /100 | #325 | Tragic 3.0% |
| Aleuts | 0.0 /100 | #326 | Tragic 3.0% |
| Bangladeshis | 0.0 /100 | #327 | Tragic 3.1% |
| Immigrants | Cabo Verde | 0.0 /100 | #328 | Tragic 3.1% |
| Chippewa | 0.0 /100 | #329 | Tragic 3.1% |
| Nepalese | 0.0 /100 | #330 | Tragic 3.1% |
| Navajo | 0.0 /100 | #331 | Tragic 3.2% |
| Yaqui | 0.0 /100 | #332 | Tragic 3.2% |
| Natives/Alaskans | 0.0 /100 | #333 | Tragic 3.2% |
| Yuman | 0.0 /100 | #334 | Tragic 3.3% |
| Colville | 0.0 /100 | #335 | Tragic 3.3% |