Bolivian vs Cherokee Married-couple Households
COMPARE
Bolivian
Cherokee
Married-couple Households
Married-couple Households Comparison
Bolivians
Cherokee
49.2%
MARRIED-COUPLE HOUSEHOLDS
99.8/ 100
METRIC RATING
30th/ 347
METRIC RANK
46.7%
MARRIED-COUPLE HOUSEHOLDS
65.7/ 100
METRIC RATING
166th/ 347
METRIC RANK
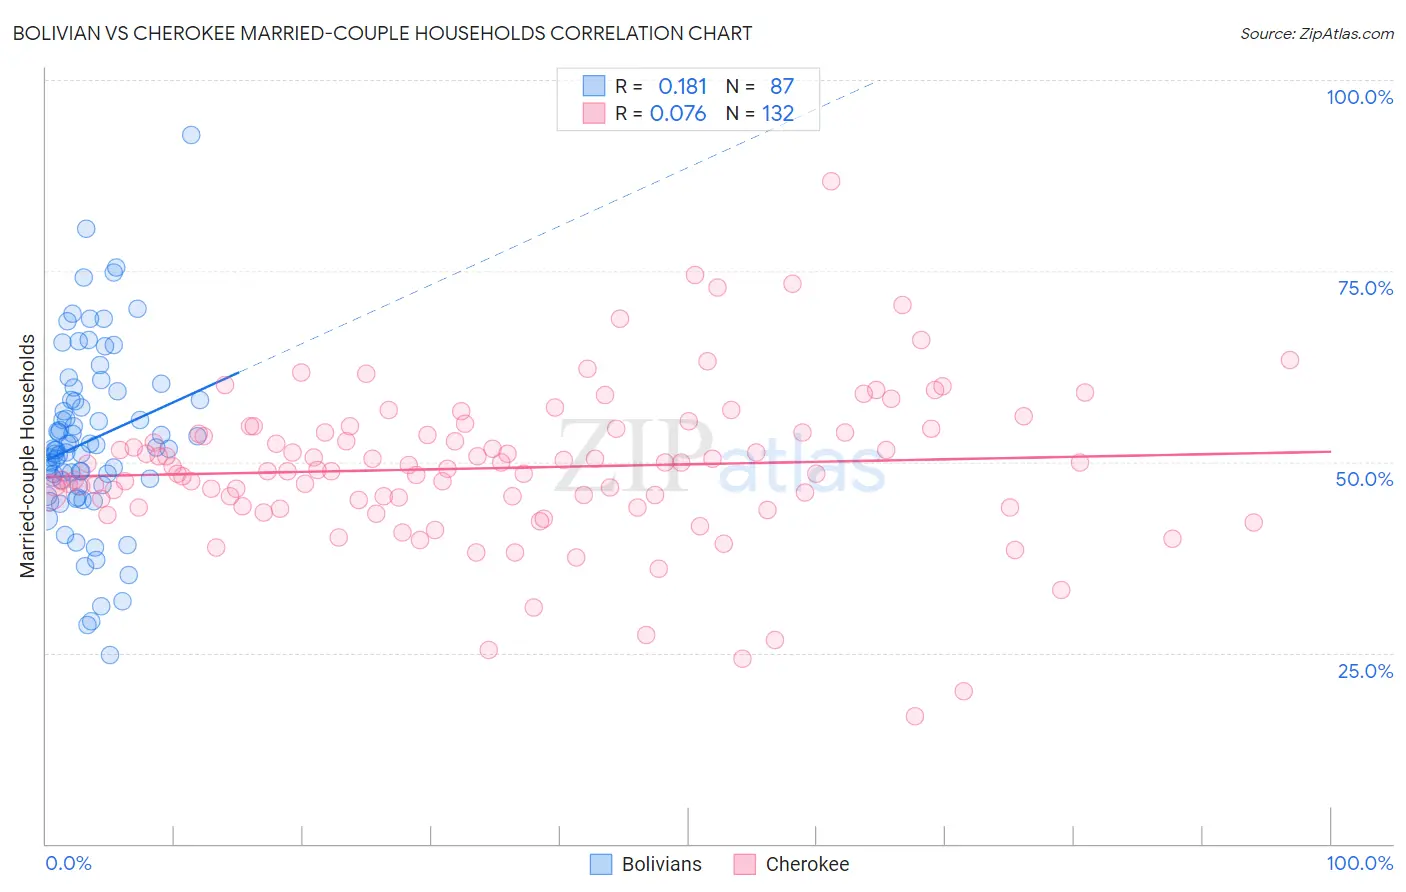
Bolivian vs Cherokee Married-couple Households Correlation Chart
The statistical analysis conducted on geographies consisting of 184,628,084 people shows a poor positive correlation between the proportion of Bolivians and percentage of married-couple family households in the United States with a correlation coefficient (R) of 0.181 and weighted average of 49.2%. Similarly, the statistical analysis conducted on geographies consisting of 493,370,237 people shows a slight positive correlation between the proportion of Cherokee and percentage of married-couple family households in the United States with a correlation coefficient (R) of 0.076 and weighted average of 46.7%, a difference of 5.2%.
Married-couple Households Correlation Summary
| Measurement | Bolivian | Cherokee |
| Minimum | 24.7% | 16.7% |
| Maximum | 92.8% | 86.8% |
| Range | 68.0% | 70.2% |
| Mean | 52.8% | 49.2% |
| Median | 51.7% | 49.0% |
| Interquartile 25% (IQ1) | 47.0% | 44.6% |
| Interquartile 75% (IQ3) | 58.2% | 53.9% |
| Interquartile Range (IQR) | 11.1% | 9.3% |
| Standard Deviation (Sample) | 11.7% | 10.1% |
| Standard Deviation (Population) | 11.6% | 10.1% |
Similar Demographics by Married-couple Households
Demographics Similar to Bolivians by Married-couple Households
In terms of married-couple households, the demographic groups most similar to Bolivians are German (49.2%, a difference of 0.020%), Maltese (49.2%, a difference of 0.020%), Native Hawaiian (49.1%, a difference of 0.11%), Hungarian (49.1%, a difference of 0.17%), and Immigrants from Asia (49.1%, a difference of 0.20%).
| Demographics | Rating | Rank | Married-couple Households |
| Dutch | 99.9 /100 | #23 | Exceptional 49.5% |
| Czechs | 99.9 /100 | #24 | Exceptional 49.4% |
| Immigrants | Philippines | 99.9 /100 | #25 | Exceptional 49.3% |
| Immigrants | Scotland | 99.8 /100 | #26 | Exceptional 49.3% |
| Bhutanese | 99.8 /100 | #27 | Exceptional 49.3% |
| Germans | 99.8 /100 | #28 | Exceptional 49.2% |
| Maltese | 99.8 /100 | #29 | Exceptional 49.2% |
| Bolivians | 99.8 /100 | #30 | Exceptional 49.2% |
| Native Hawaiians | 99.8 /100 | #31 | Exceptional 49.1% |
| Hungarians | 99.8 /100 | #32 | Exceptional 49.1% |
| Immigrants | Asia | 99.7 /100 | #33 | Exceptional 49.1% |
| Italians | 99.7 /100 | #34 | Exceptional 49.0% |
| Scottish | 99.7 /100 | #35 | Exceptional 49.0% |
| Iranians | 99.7 /100 | #36 | Exceptional 49.0% |
| Sri Lankans | 99.7 /100 | #37 | Exceptional 49.0% |
Demographics Similar to Cherokee by Married-couple Households
In terms of married-couple households, the demographic groups most similar to Cherokee are Immigrants from Croatia (46.7%, a difference of 0.060%), Israeli (46.7%, a difference of 0.14%), Immigrants from Kazakhstan (46.8%, a difference of 0.18%), Immigrants from Southern Europe (46.8%, a difference of 0.18%), and Immigrants from Turkey (46.8%, a difference of 0.19%).
| Demographics | Rating | Rank | Married-couple Households |
| Osage | 73.2 /100 | #159 | Good 46.9% |
| Iraqis | 71.7 /100 | #160 | Good 46.9% |
| Delaware | 71.2 /100 | #161 | Good 46.8% |
| Colombians | 71.0 /100 | #162 | Good 46.8% |
| Immigrants | Turkey | 70.2 /100 | #163 | Good 46.8% |
| Immigrants | Kazakhstan | 70.0 /100 | #164 | Good 46.8% |
| Immigrants | Southern Europe | 69.9 /100 | #165 | Good 46.8% |
| Cherokee | 65.7 /100 | #166 | Good 46.7% |
| Immigrants | Croatia | 64.2 /100 | #167 | Good 46.7% |
| Israelis | 62.3 /100 | #168 | Good 46.7% |
| Spanish American Indians | 59.4 /100 | #169 | Average 46.6% |
| South Americans | 58.0 /100 | #170 | Average 46.6% |
| Immigrants | Chile | 55.7 /100 | #171 | Average 46.5% |
| Immigrants | Australia | 54.6 /100 | #172 | Average 46.5% |
| Immigrants | Norway | 52.0 /100 | #173 | Average 46.5% |